

Cumulative Flow chart presents the relative amount of work for each stage of project over time. Colored areas on the diagram represent work in progress for each stage of a process.
The following figure displays the Cumulative Flow chart generated for the period between February and July.
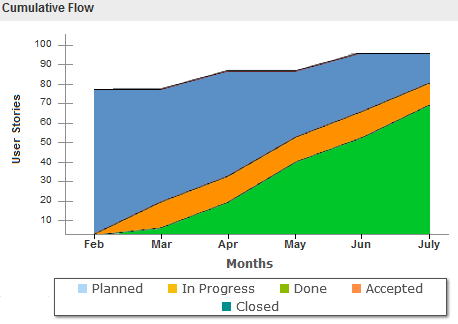
The vertical axis of the chart displays how many items are currently in progress. The horizontal axis displays the duration it takes for a task to complete. Measuring the horizontal axis on a Cumulative Flow chart allows you to monitor the Cycle Time and forecast when all the work in progress will complete. Vertical axis helps you to set the right WIP limits.
Follow these steps:
You have successfully used Kanban Board to manage and track the product backlog work.
You can change the way some details pages look by adding, editing, or deleting the following properties of the page:
The changes that you make are at the system level and apply to all users. You can rename sections and fields to accommodate your business needs. You can restore them if you want to revert to the default sections and fields that have been deleted or renamed.
Only the properties portion of the details pages can be modified. Related list sections that are found on the details page that are not part of the properties cannot be modified. The following list shows the details pages that you can configure.
Only a super user or system administrator can customize a properties page. Agile super user can customize only Agile pages, and Requirements super user can customize only Requirements pages. An Agile/Requirements super user can customize pages in both Agile and Requirements.
|
Copyright © 2013 CA.
All rights reserved.
|
|