

The following screenshot details the Investigator:
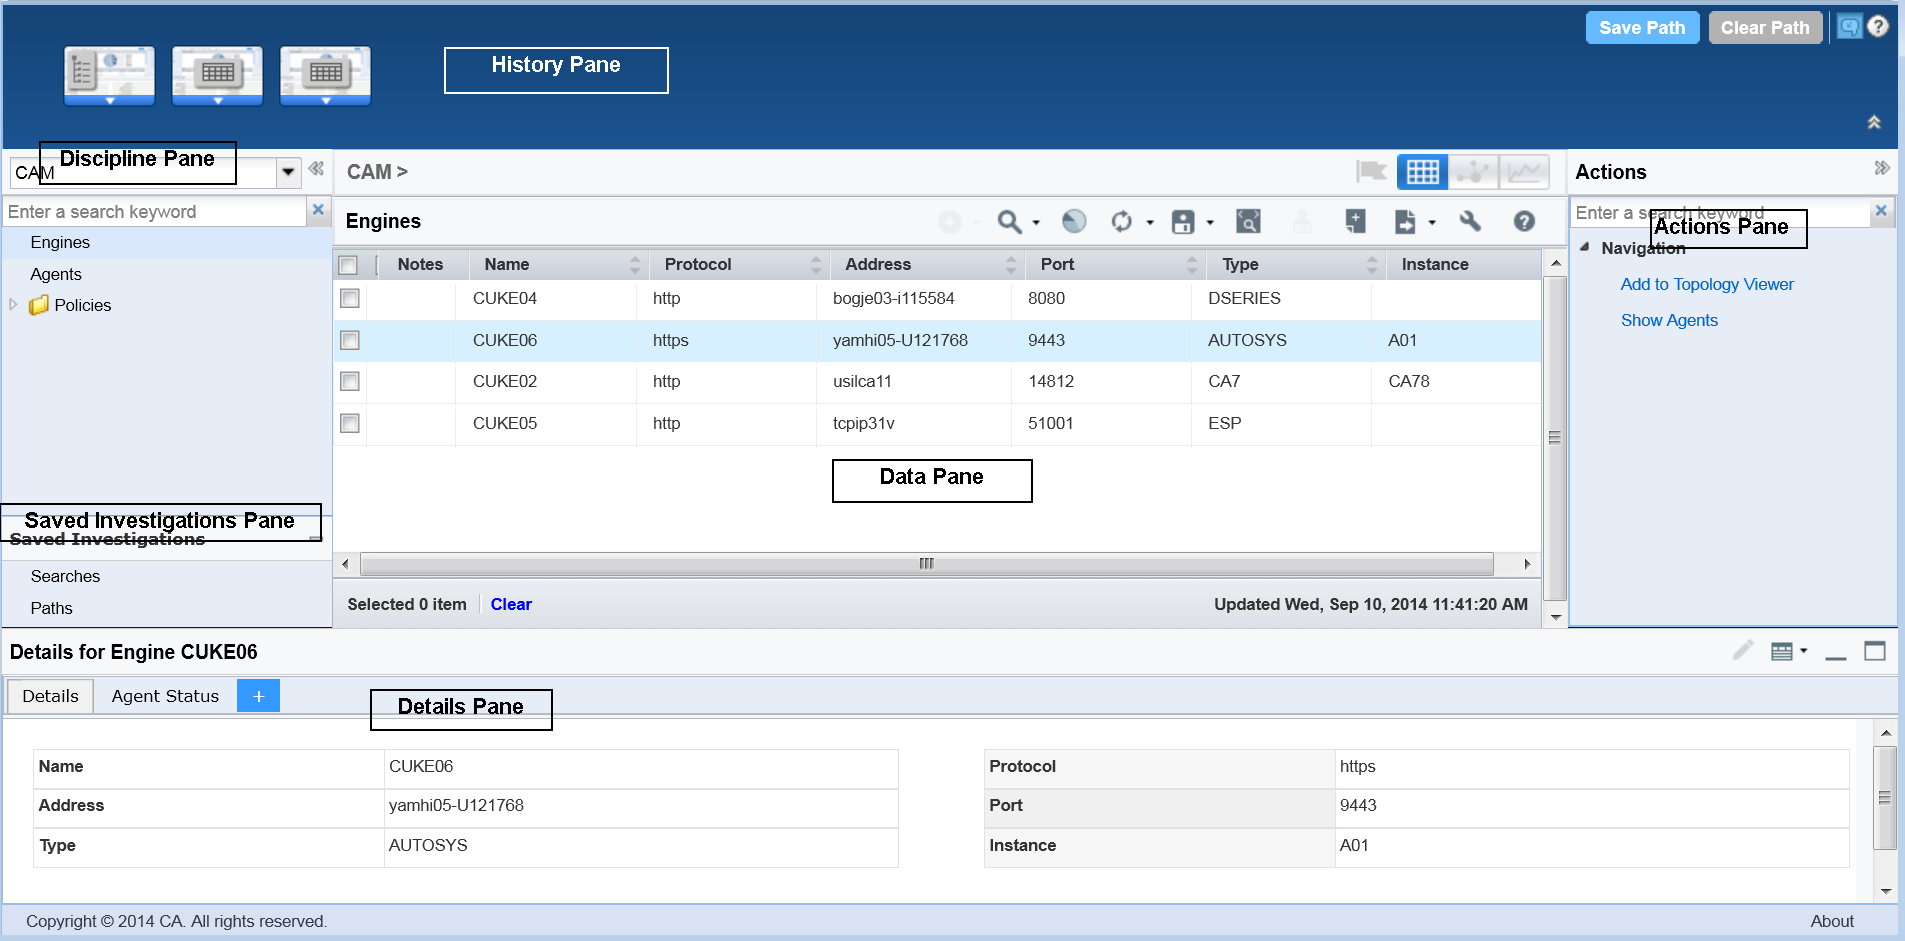
The Investigator provides a wider view and access to searches and paths across all disciplines. The Investigator window has the following panes:
Displays discipline-specific objects and helps you retrieve data for querying, analyzing, maintaining, and monitoring systems.
The Discipline drop-down list also includes the available disciplines and an option to add custom objects to the Investigator. To access shared dashboards, maps that are saved from the Topology Viewer, and policies, select Chorus from the Discipline drop-down list.
The Investigator lets you save new policies that are specific to your needs.
Note: For more information about saving new policies, see Save a Policy.
Displays links to saved Searches and Paths, which let you view search history and investigation paths in the Data pane. For a list of actions for both options, see the Actions pane.
Displays all data for the selected object in the tree in a table view by default. The table contains all properties of a path displayed in columns. When you select a path in the table, detailed path information appears in the Details pane. You can view the SQL query behind the data in the table view by clicking the View SQL icon (![]() ). The auto-refresh option is enabled by default for authorized users. When this option is enabled, any changes in back-end data refresh the front-end data once every 30 seconds. For example, when the server generates new alerts, they appear in the Alerts module after 30 seconds. Click Refresh (
). The auto-refresh option is enabled by default for authorized users. When this option is enabled, any changes in back-end data refresh the front-end data once every 30 seconds. For example, when the server generates new alerts, they appear in the Alerts module after 30 seconds. Click Refresh (![]() ) to disable or enable the auto-refresh option. If you are not an authorized user, click Refresh (
) to disable or enable the auto-refresh option. If you are not an authorized user, click Refresh (![]() ) to refresh the data manually.
) to refresh the data manually.
You can select rows or can highlight a row in the Data Pane. The following screenshot illustrates a selected row:
![]()
The following screenshot illustrates a highlighted row:
![]()
The following screenshot illustrates a highlighted and selected row:
![]()
The following table differentiates selecting and highlighting:
|
Selecting |
Highlighting |
|---|---|
|
Select the check box on each row to select those rows. Select the Select All check box to select all rows. After using this option, you cannot cancel the selection of individual rows. |
Click anywhere on the row except the check box to highlight that row. You can highlight only one row at a time. |
|
Cancel the selection of a row by clearing the check box on that row or by clicking the Clear button on the status bar. When you select the Select All check box to select all rows, you cannot cancel the selection of individual rows. Cancel the selection of all rows by clearing the Select All check box or by clicking the Clear button on the status bar. |
Cancel the selection of a row by highlighting the same row again, by selecting the same row using the check box, or by clicking the Clear button on the status bar. |
|
For both single-row and multi-row selections, the Details pane shows no data. |
See the details of the highlighted row in the Details pane. When you highlight a row that is already selected, the Details pane shows the details. |
|
When a single row is selected and no row is highlighted, the Action pane shows actions corresponding to the selected row. When multiple rows are selected and no row is highlighted, the Action pane shows actions that are common to the selected rows. When a single row or multiple rows are selected and a row is highlighted, the Actions pane shows the actions corresponding to the highlighted row. |
See the actions corresponding to the highlighted row in the Actions pane. |
|
The Notes icon ( |
The Notes icon is enabled. |
|
The Status bar displays the count of selected rows. |
The Status bar does not display the count of highlighted rows. |
Displays actions based on your selection about discipline and object. You can manipulate data or can drill further into data for analysis. Actions appear as active links under different categories. You can resume an incomplete path, load a complete path, and delete a saved path.
Displays detailed information of a highlighted path in the table.
Note: If you customize the Data pane to include columns from a related table, the new columns do not appear in the Details pane.
As a CA ACF2 or CA Top Secret user, you can edit the details available in the Details pane by clicking the edit icon (![]() ). When you click the edit icon, all the tabs in the Details pane enter into edit mode. Make the required changes and click Save. The edit option is not available for an IBM RACF user.
). When you click the edit icon, all the tabs in the Details pane enter into edit mode. Make the required changes and click Save. The edit option is not available for an IBM RACF user.
Note: You can edit only the fields of the objects that are set as editable.
Add a tab to the Details pane by clicking the + icon on the tab header. Right-click inside a tab and select Insert Field to add fields to the tab. To delete a field or a tab, right-click and select the Delete option. The Details pane must have at least one tab on it, so you cannot delete all the tabs. To change the name of a tab, double-click the name. The drag-and-drop option helps you rearrange the fields. To select multiple fields, use the Ctrl or Shift keys. After customizing the Details pane, you can save the latest view. Saving a view helps you or others reuse the view. To save a view, click the View icon, click Save View, provide a name and description for the view, select the permissions, and click Save. To reuse a view, click the View icon, click Manage Views, click the + sign on the view, and select Apply. The owners can edit and delete their views.
Note: The view that you have saved or applied becomes your default view. To restore the initial view of the Details pane, use the System Default button.
Displays the steps that you take in an Investigator session. A breadcrumb in this pane represents one step, and the breadcrumb for the current step is highlighted. This pane lets you follow the steps you or other users made to reach a certain result. These steps form a path. You can save paths as Private to review later or set as Public to let others view.
|
Copyright © 2014 CA Technologies.
All rights reserved.
|
|