

Viewing Infrastructure Management Object Performance Data in the Investigator › Perform Infrastructure Management Actions on Object Data in the Investigator › Use the Alerts Module to View and Manage Alerts
Use the Alerts Module to View and Manage Alerts
The Alerts module lets you monitor and investigate alerts from the dashboard as they are generated. The alert provides immediate knowledge about a problem occurring on your CA Chorus Infrastructure Management discipline. The Alerts module displays only current information.
As a network administrator, I want to monitor the network activity. Use this procedure when you configure the network alerts.
Follow these steps:
- Log in to CA Chorus
- Click the plus sign icon on the dashboards tab, enter a name for your dashboard, and click Add Dashboard.
The dashboard name can be up to 21 characters. Valid characters are numeric (0 through 9), alpha (a to z) and (A to Z), underscores, and blank spaces.
- Add the Alerts module to your customized dashboard from the Module Library.
- Follow the prompts to configure the module. For example, click the alerts configuration link, select Network Alerts.
- (Optional) Customize the module label. For example, rename Network Alerts to NetMaster Region.
This text appears in your module header. This information is useful when you have multiple Network Alerts modules on the same dashboard.
- Click Save.
The Alerts module opens.
- Click the wrench icon and use the Select and Reorder Columns dialog to customize the tabular data view to display the NetMaster Region.
- Move the NetMaster Region from the Available column to the All selected Columns.
- Move the NetMaster Region up to the first entry in the list by clicking the up arrow.
- Click the Save button.
The customized Alerts module is available to display alerts on the NetMaster Region.
- (Optional) Repeat this procedure when you are adding multiple modules to one or more dashboards.
Your customized Network Alerts module is available for monitoring on your dashboard.
Use the Policy Status Light Module for Color-Coded Monitoring
The Policy Status Light module lets you monitor your policies from the dashboard with a color-coded view. This color-coded view lets you see at a glance when the system exceeds the specified limits in your policies.
Follow these steps:
- Choose the Policy Status Light module from the Module Library and click Add.
The Policy Status Light is added to your dashboard.
- Click configure the policy status light link.
The Policies Object Picker opens.
- Select Infrastructure Management from the Policies drop-down list.
- Select the policies that you want to monitor. The available CA Chorus Infrastructure Management policies include:
- CICS Threshold Policies
- CICS State Policies
- IMS Threshold Policies
- IMS State Policies
- IP Stack Policies
- WebSphere MQ Threshold Policies
- WebSphere MQ State Policies
- z/OS Threshold Policies
- z/OS State Policies
- Select the rows for monitoring by clicking each check box. You can also use the Select All check box in the header row to select all policies in the table. If you use Select All, then future policies for that system are automatically added to the Policy Status Light module. Click Save to apply your changes.
The Policy Status Light displays policy status in your Dashboard. The following colors and icons indicate the health state of your policies:
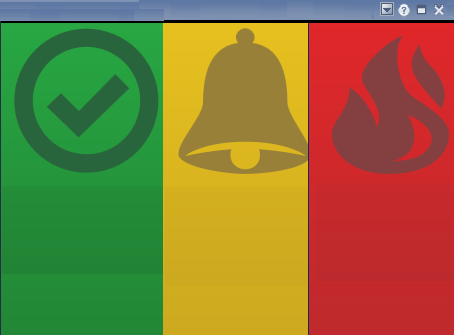
Note: Unknown state indicates that the performance data of the policy object cannot be retrieved.
Hover over a Policy Status Light to see the list of objects that are in the same condition.
Example: Add two Policy Status Modules. A z/OS Policy containing MSU consumption rates and a WebSphere MQ Policy containing inactive channels.
You noticed the z/OS threshold policies registering high MSU (millions service units) consumption rates on a specified system. You want to add a traffic light to track the MSU four-hour average and the MSU four-hour average percentage consumption spikes.
You also want to monitor the status of your WebSphere MQ inactive channels.
Follow these steps:
- Add the Policy Status Light module to your dashboard.
- Click the link configure the policy status light.
- Select Infrastructure Management from the policies drop-down list.
- Select z/OS Threshold Policies.
- Check the boxes for MSU4HAVG and MSU4HPCT and click Save.
- Add a title and description and click Save.
The Policy Status box for MSU4HAVG and MSU4HPCT displays on your dashboard.
- Use drop-down and click the Group by Policy.
To add the Policy Status Light module for the WebSphere MQ inactive channels:
- Perform steps 1 through 3 and select WebSphere MQ State Policies.
- Click View Filter, select State equal (=) and type INACTIVE, and click Search.
- The display refreshes and displays Check the boxes for monitoring and click Save.
- Add a title and description and click Save.
The Policy Status box containing the WebSphere MQ inactive state policies displays on your dashboard. You can optionally use the drop-down to filter your views.
You can see at a glance the two traffic lights on your dashboard:
This color-coded view provides a visual status when these policies have changed or exceeded the thresholds.
Copyright © 2013 CA Technologies.
All rights reserved.
|
|