

The assumption is that an executive manager might be interested in high level view across departments countries accounts etc. An executive manager usually is not operational and requires views that provide him information to take decisions in terms of strategy. Therefore contractual status rather then current status might be more relevant for displaying in executive manager maps and aggregative Dashview.
For example, the following Dashviews may be included on the Overview page:
|
Dashview |
Description |
|
Critical accounts |
Includes all contract parties that are marked as sensitive. The executive manager selects the contracts or contract parties that from his point of view considered as sensitive. |
|
Overall performance |
Includes custom widgets of overall quality, widgets of aggregative view that include all KQI's of the accounts. |
|
Departments |
Uses background image with organizational chart and place the widgets on the relevant departments. Usually Service Component Group is useful here depending on what a department represents in the organization. |
|
Geographies |
Uses background image with a geographical map and locate contract party groups widgets on the relevant locations. |
|
Financial performance |
Includes widgets that include aggregative information on financial metrics |
|
URL |
Includes pages from the corporate portal for example leads in the sales force for example |
Recommended Reports for the page:
|
Report |
Description |
|
Deviation report |
Ten worst contracts for a certain period, provides information on the areas that are in the worst performance in terms of the service delivery. |
|
Financial report for the current month |
Summarizes the financial status aggregated thru time |
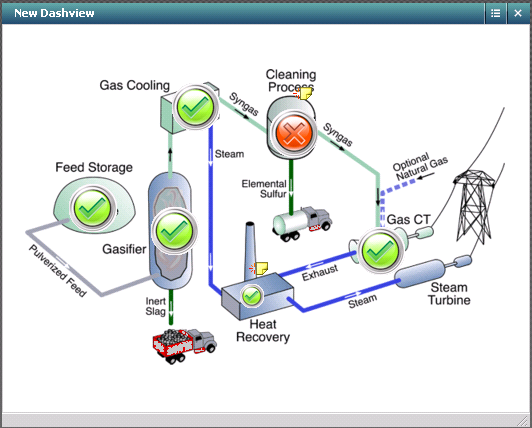
Process page:
This page should contain a Dashview that presents a process diagram with widgets that represents each chain in the process as in the example below:
|
Copyright © 2013 CA.
All rights reserved.
|
|