The Deviation value is calculated automatically by the CA Business Service Insight Engine for Metrics that have a target. The value represents the difference between the actual service level and the target. The deviation calculation formula, calculated automatically by CA, changes according to the service level definition: whether the service level target is a maximum (when the actual service level is "no more than"), or a minimum value (when the actual service level is "no less than"'). See below an example of how the formula changes:
|
Target Statement |
Service Level Threshold |
Deviation Formula |
|
Service should be available at least 99% of the scheduled time. |
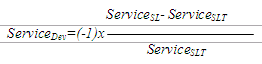
Target is the minimum threshold |
|
|
Average MTTR should not exceed 4 hours per month. |
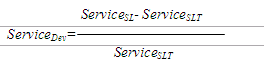
Target is the maximum threshold |
|
Where ![]() = Service deviation
= Service deviation
Where ![]() = Expected service performance
= Expected service performance
Where ![]() = Actual service performance
= Actual service performance
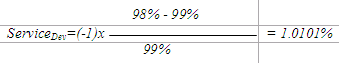
The following example illustrates a minimum deviation calculation:
Service should be available for at least 99% of the scheduled timeslot. The actual service level is 98% during the scheduled timeslot.
Deviation reports are used for high level views of guarantees of a foreign nature (different type of calculation), and to aggregate them into a single bar with common grounds.
If, for example, in the contract is the following matrix:
|
Service-Helpdesk |
Service Domain- Ticket management Priority 1 |
Service Domain- Ticket management Priority 2 |
Service Domain- Ticket management Priority 3 |
|
|
P1 average resolution time |
P2 average resolution time |
P3 average resolution time |
|
|
P1 % of tickets resolved within T1 |
P2 % of tickets resolved within T1 |
P3 % of tickets resolved within T1 |
|
|
P1 % of tickets responded within T1 |
P2 % of tickets responded within T1 |
P3 % of tickets responded within T1 |
|
|
P1 average response time |
P2 average response time |
P3 average response time |
The results of generating a Service Domain report filtered by Helpdesk Service are as shown in the following graph.
The above report allows the Service Level Manager to see how well the helpdesk is performing based on various priorities, regardless of the contract or type of obligation.
All helpdesk Metrics are aggregated into a single bar based on their priority.
For example, the Priority 1 bar shows the three Metrics defined within the Metric and aggregates their deviation into a single value. (The aggregation method can be chosen in the report wizard to be average / minimum / maximum.
With such a report, the manager can conclude for example, that he/she needs to invest more resources in Priority 1 tickets or change the contracts related to them.
This example shows that modeling provides both the report on a single obligation which shows whether a contract was honored or breached, but also a broader management report that allows the Service Level Manager to manage his resources more efficiently and thereby improve his service components.
|
Copyright © 2013 CA.
All rights reserved.
|
|