The graphs that you draw with the Plot feature contain these elements:
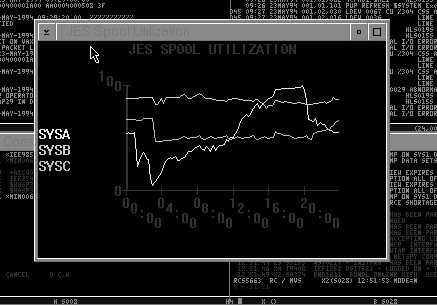
A sample graph displaying the JES SPOOL usage for several systems over a 24-hour period is shown next. The sample application containing the PLOT statements necessary for creating the graph is available in the sample directory; see the SPLPLOTX.txt file for more information.

Most of the examples in the remainder of this chapter show actual PLOT commands for setting up or modifying the data in the SPLPLOT graph.
| Copyright © 2012 CA. All rights reserved. |
|