

On the Operations page, the Performance by Application report displays the worst-performing applications reported to the management console. To display all networks affected by the performance degradation, click the application name at the top of the list.
As you look down the charts of servers and networks, you can select those whose ratings match the ratings in the Selected Component page. For example, if this is the view of the application performance:

Click this performance bar and view the Narrow by Network page on the subsequent page:
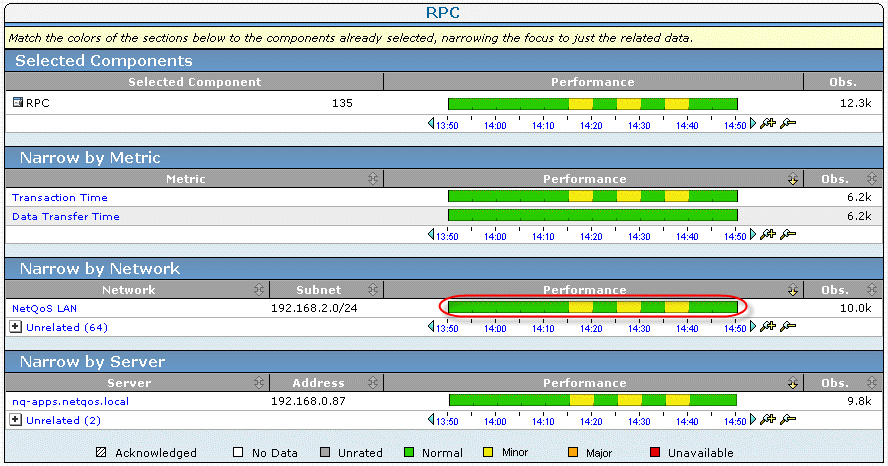
You can easily see the networks involved.
|
Copyright © 2015 CA Technologies.
All rights reserved.
|
|