

Because performance OLAs give additional insight into the slowest performing transactions, it is important to understand what a typical time slice of performance looks like. Most people are familiar with a standard distribution or bell curve, and when talking in terms of percentiles these usually come to mind. However, TCP transactions do not follow a normal distribution. Instead, there is minimum latency that is due to distance for Network Round Trip Time and I/O in Server Response Time (SRT). Ideally, you want to have as many transactions as close to this minimum as possible.
The following example shows an idealized version of what the management console sees over a given time period for Network Round Trip Time. When performance degrades, the entire curve could shift to the right, or the tail in the curve could extend. This situation is one where OLAs are useful.
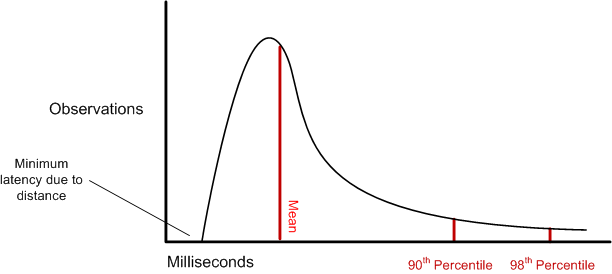
OLAs enable the user to specify a threshold for the 90th and 98th percentiles. Note that the user can specify any percentile. Reports show what percentile of those values actually reached the threshold. Adjusting the thresholds lets you monitor tail behavior and set OLAs in a goal-oriented manner.
|
Copyright © 2015 CA Technologies.
All rights reserved.
|
|