

Server Response Time (SRT) is the amount of server "think time" that passes between the instant a server receives a client request packet, to the instant it puts the first response packet on the network. SRT is affected by the following:
Generally the faster the server hardware, the better written the application, and the lower the server utilization -- the lower the SRT. SRT values vary by server platform and application.
General rating of Server Response Time values are shown in the following table. Applications are single-tiered unless noted.
|
Application |
Excellent |
Good |
Poor |
|---|---|---|---|
|
Citrix |
50ms |
75ms |
200ms |
|
Citrix (two-tier) |
90ms |
125ms |
200ms |
|
CRM (2-tier) |
70ms |
90ms |
200ms |
|
HTTP (Java, 2-tier) |
120ms |
150ms |
250ms |
|
HTTP (no Java) |
75ms |
90ms |
200ms |
|
Lotus Notes |
50ms |
75ms |
200ms |
|
MS Exchange |
50ms |
75ms |
200ms |
|
MS SQL |
60ms |
90ms |
150ms |
|
MS Terminal Services |
50ms |
75ms |
200ms |
|
MS Terminal Services (2-tier) |
90ms |
125ms |
200ms |
|
Oracle |
50ms |
75ms |
200ms |
|
Other |
75ms |
90ms |
200ms |
|
Other (2-tier) |
90ms |
120ms |
200ms |
You can trend Server Response Time over time to determine long-term issues. A precipitating event might signal an opportunity for further analysis. Consider this server incident in the Incidents page:
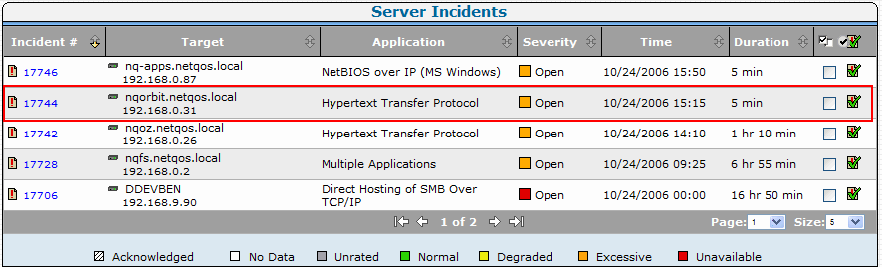
Click the link for the incident to display details of the metric that crossed a threshold and initiated the incident:
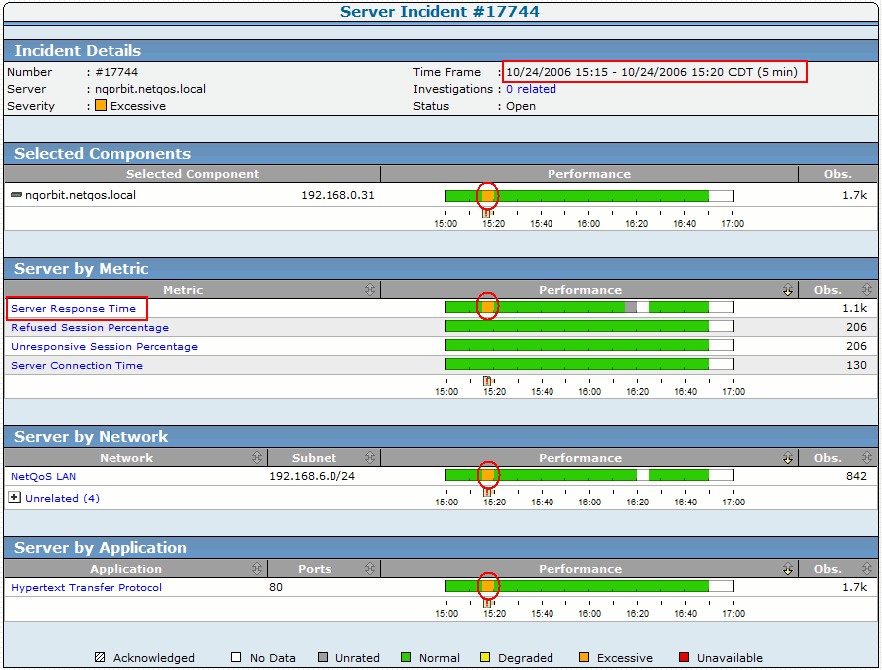
The 5-minute period when the incident opened is easy to see, and the metric that caused it was the Server Response Time.
Click Explore in the header to see the following detail view. The time frame shown on this view is the same as on the previous page. You might want to see if there is any pattern in a longer-term view of this server and metric. Longer-term views are available in the Engineering page. You can leave this window open for reference.
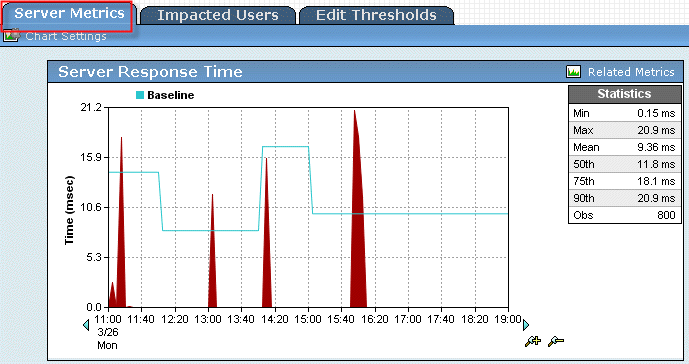
Click the Engineering link in the header to display the following view. This view is of the same time frame, and therefore looks the same as the view from the Incidents page.
To change the time frame to a longer term, click Settings at the top of the page.
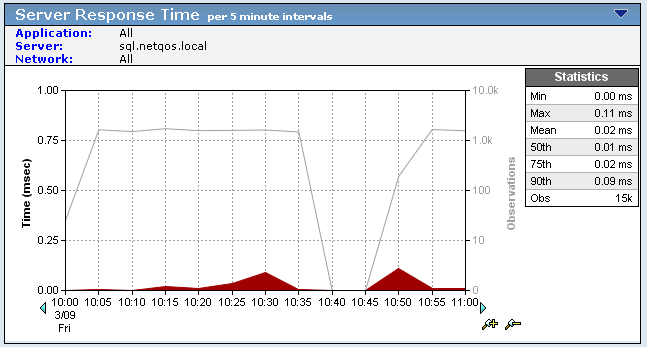
You can also investigate the other metrics related to the incident from any report page in the Engineering page. A high metric such as Refused Sessions indicates that the server is operational, but is too busy to answer a request.
|
Copyright © 2014 CA Technologies.
All rights reserved.
|
|