

A QoS policy can improve response times for remote users by prioritizing critical application traffic. This example shows how to validate that it actually did. In this example, the policy was implemented yesterday afternoon just after lunch.
The following report appears:
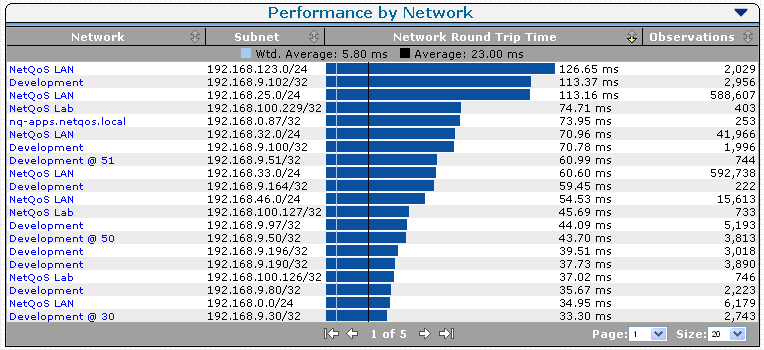
This view of the daily Network Round Trip Times shows the networks with the highest latency. The 56 K and VPN connections typically exhibit the slowest response.
The QoS policy was implemented in the Pittsburgh, PA link. Effects of the QoS policy change are shown in the Network Round Trip Time view:
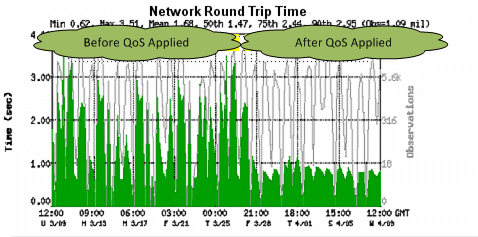
The time before the QoS policy being applied shows a marked contrast to the faster times after the policy was implemented.
|
Copyright © 2014 CA Technologies.
All rights reserved.
|
|