

Using the Management Console › Report Page Navigation › Change Report Settings
Change Report Settings
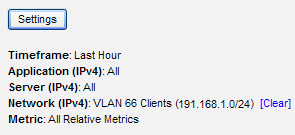
The management console displays the current page and report settings below the Settings button at the top of each report page. In the following example, the management console shows data for the last hour for all applications and servers on the 191.168.1.0 network, and includes all relative metrics in the views and reports.
Click the Settings button to change the report settings:
- Timeframe
-
Click the timeframe you want from the list, and choose whether to include data collected during schedule maintenance. Depending on the timeframe you choose, there can be a gap between the current time and the latest data in a report. For example, if you set the timeframe to a week, the reporting resolution is 60 minutes, so you may see up to a 55 minute gap.
- Less than or equal to 8 hours displays 5-minute increments
- Less than or equal to 16 hours displays 10-minute increments
- Less than or equal to 24 hours displays 15-minute increments
- Less than or equal to a week displays 60-minute increments
- Less than or equal to a month displays 6-hour increments
- Metrics
-
Click to choose the metric or group of metrics you want. For example, from the Incidents page, you can choose All Server Metrics or a particular server metric.
- Application/Server/Network Combination
-
Choose the combination of applications, servers and networks you want:
- Click the X button to clear an application, server, or network selection, and then make another selection.
- Click Select Group for All to apply a group filter from the CA PC or CA NPC to the applications, servers, and networks. To override the group filter, click the X button and then click the application, server or network you want.
- To search for an application, server or network, type the name you want and click Search.
- If you have created domains to separate duplicate IP traffic, choose the domain you want. This option filters the list of servers and networks to the corresponding domain. By default, the Default Domain applies to all servers and networks.
Copyright © 2014 CA Technologies.
All rights reserved.
|
|