

Welcome to Application Delivery Analysis › Log Into the Management Console › Navigation Tips and Tricks
Navigation Tips and Tricks
As you become familiar with the management console interface, keep the following tips in mind.
- When you view report pages and views on the management console, navigate to reports by clicking networks, applications, metrics, incidents, and other listed items in the blue font to get detailed information.
- Watch for and click the link in any information boxes where you see this symbol:
 . The management console uses the information boxes to guide you through processes and to prompt you for additional information.
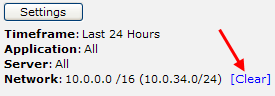
- After you click a blue item in a report or view and examine the information, click [Clear] in the Settings area to return to the higher-level data or page.
- Hold your mouse over items such as controls or portions of views to see helpful ToolTip information. Hold your mouse over a bar representing an interface in a view to get details about the interface such as its router, description, and speed.
- Share information by printing, emailing a report page or a view, or saving a report page or view to a spreadsheet. To print, email, or export an entire report page, use the buttons at the top of the report page. To print, email, or export a view, use the blue gear menu (
 ) at the top of a view.
- Sort the data in views in ascending or descending order by clicking a column heading to change the sort order.
- If you add the management console as a data source in the CA Performance Center or CA NetQoS Performance Center, you can access the attached Performance Center from the management console by clicking the NPC link in the upper-right corner of the management console. For information about using the CA Performance Center or the CA NetQoS Performance Center, see the CA Performance Center or CA NetQoS Performance Center documentation.
Copyright © 2014 CA Technologies.
All rights reserved.
|
|