

Performance thresholds turn an advanced trend report from the Engineering page into a bar chart report on the Operations page that is easily read.
Performance thresholds help you recognize performance problems and allow the management console to automatically launch responses to notify or investigate a problem.
Thresholds are boundaries of acceptable performance behavior that exist for each system- and user-defined application. Thresholds are important because they:
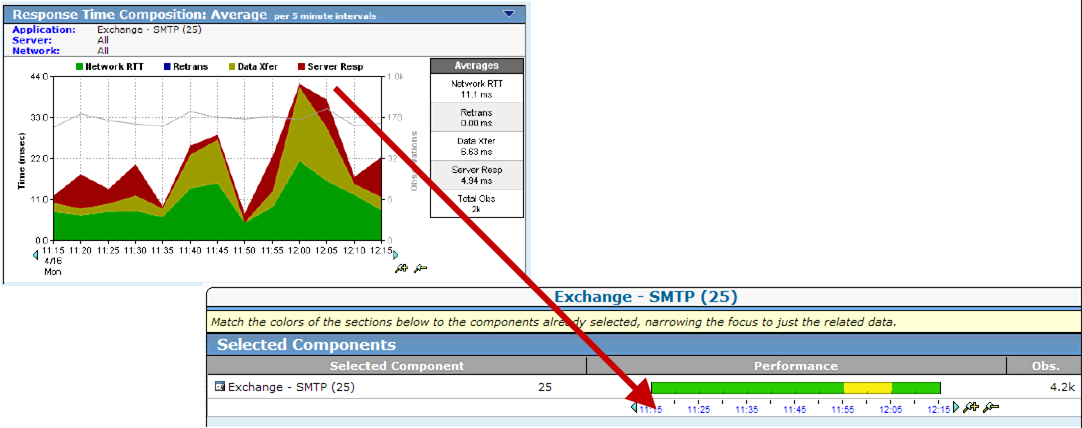
When performance thresholds are properly configured, the colors on the bar chart correspond to real performance issues or metric degradations. Accurate threshold tuning makes pinpointing the cause of these issues a simple matter of matching colors.
The yellow and orange severity indicators are intended to draw attention to Minor and Major performance degradations. We recommend calibrating threshold settings to make sure the severity indicators correspond to the actual conditions that cause network users to submit Help Desk tickets.
When the management console sees degraded application performance on a server or network, the management console automatically opens an incident. Available from the Incidents page, an incident creates a record of information about a performance problem.
After your performance threshold settings are properly adjusted, choose how the management console should respond to network and server incidents, for example, by sending an email notification when application performance on a particular client network degrades.
|
Copyright © 2014 CA Technologies.
All rights reserved.
|
|