

|
At a Glance |
|
|
Catalog |
System |
|
Category |
Database Appliances |
|
User volumes |
yes |
|
Min. memory |
160 MB |
|
OS |
Linux |
|
Constraints |
no |
|
Questions/Comments |
|
Important! PGSQL is not available in CA AppLogic 2.8+; Please use PGSQL64 instead.
PGSQL64 is a database appliance based on the PostgreSQLdatabase engine (http://www.postgresql.org). It provides an easy way to add a database to any application. PGSQL64 is an enterprise-style database appliance that supports many features that are currently not supported by the MYSQLx appliances. Some of these features include stored procedures, triggers, views and user-defined data types.
PGSQL64 stores the database on an application-defined volume that can be configured on each PGSQ64L instance. PGSQL64 optionally creates an empty database when it starts on an empty volume. The PGSQL64 database volume cannot be shared among multiple PGSQL instances (one database volume per PGSQL instance).
PGSQL64 clients access the configured database through the in terminal. The database requests are processed and completed back through the same terminal. PGSQL64 allows any valid Postgres user to access the database through the in terminal (the appliance has one preconfigured superuser role: standard 'postgres'). PGSQL64 can be configured with the maximum number of concurrent connections supported through in.
PGSQL64 also has the ability to maintain a database log accessible through the log terminal. The log is useful for tracking database information and error logging. The log path, name, age and contents are configurable. In addition, various database statistics and debugging information may also be enabled to help with profiling database access patterns and diagnosing problems/errors.
PGSQL64 is typically used for either general purpose web database applications (small databases with a large number of users who execute simple queries) or decision-support databases (large databases with a small number of users who execute complex queries).
|
Name |
Latest Version |
OS |
PostgreSQL |
Notes |
|
PGSQL64 |
3.0.2-1 |
CentOS 6.3 |
9.0.10 |
|
|
Resource |
Minimum |
Maximum |
Default |
|
CPU |
0.1 |
16 |
0.4 |
|
Memory |
160 MB |
32G |
512 MB |
|
Bandwidth |
1 Mbps |
2 Gbps |
250 Mbps |
Note: Memory should be increased based on two main factors: number of concurrent users and database size. Typically, PGSQL can support about 80 concurrent users per 128 MB of memory. The larger the database, the more memory PGSQL should have for processing. For example, PGSQL should be configured with at least 1G of memory for a 10G database - more than 1G for better performance.
|
Name |
Dir |
Protocol |
Description |
|
in |
in |
PGSQL |
Receives PostgreSQL database requests from clients. |
|
log |
out |
CIFS |
Used to access a remote file system for storing error logs. This terminal may be left unconnected if not used. |
|
mon |
out |
CCE |
Sends performance and resource usage statistics. This terminal may be left unconnected. |
The default interface is enabled. It is intended for diagnostics and troubleshooting (over SSH). Future versions of this appliance may disable SSH access.
|
Volume |
Description |
|
data |
Volume for the database data storage. |
Important! The data volume must exclusively dedicated to the PGSQL instance (cannot be shared with other appliances).
Note: None of the PGSQL properties are case sensitive excluding file names and paths.
|
Property name |
Type |
Description |
|
auto_create |
String |
Whether to create the database if it does not exist. Possible values are yes to create it and no to prevent auto creation (to avoid accidental overwrite in case of corrupted volumes). If set to no and a database doesn't exist on the user volume, the appliance starts in maintenance mode (PostgreSQL deamon not started). |
|
read_only |
String |
The database accessed through the in terminal is read-only. Possible values are yes for read-only and no for read/write. This property is used by PGSQL only to optimize performance for the database (read-only databases do not need garbage collection, and so on). |
|
max_connections |
Integer |
The maximum number of concurrently active connections to the database that PGSQL should handle through the in terminal. PGSQL uses this value in advanced calculations for memory management. In general, PGSQL needs 128MB of memory for every 80 concurrent connections. Once the connection limit is reached, PGSQL refuses all subsequent connections. |
|
query_complexity |
String |
This property specifies the general complexity of the queries that users would execute against the database used with PGSQL. Possible values are: |
|
sync_on_write |
String |
Whether PGSQL should wait for database updates to be physically written to disk (mainly when committing transactions). Possible values are yes to wait for physical disk updates or no to cache the updates and write them at a later time thus improving performance (delayed write). Setting this property to yes may result in a performance penalty but also ensures that the database can recover to a consistent state after an appliance crash or failure occurs. Note if the database is specified as read-only, PGSQL automatically disables this feature and ignores the value of this property. |
|
timezone |
String |
Specifies the time zone used in the appliance. If this property is empty, the timezone is not modified and left as-is. A list of supported time zones is available. Default: empty |
|
Property name |
Type |
Description |
|
log_filename |
String |
File name for the database log file, relative to the file system accessed through the log terminal (for example, postgresql.log for /mnt/log/postgresql.log, or /pgsql_logs/postgresql.log for /mnt/log/pgsql_logs/postgresql.log). If empty, logging is disabled. %-escapes may be specified in the log filename (the same as the Linux strftime pattern - see the reference section at end of this topic for a full list of %-escapes). If no %-escapes are used, PGSQL appends the epoch of the log file's creation time. The default value is (empty). |
|
log_age |
Integer |
The maximum lifetime of the log file; specified in minutes. After the specified number of minutes have elapsed, a new log file is created using the log_filename property. PGSQL truncates the log file if it already exists; this allows log rotation. Set to 0 to disable time-based creation of new log files. |
|
log_size |
Integer |
The maximum size of a log file; specified in megabytes. When the log file reaches the specified size, a new log file is created using the log_filename property. PGSQL truncates the log file if it already exists; this allows log rotation. Set to 0 to disable size-based creation of new log files. |
|
log_level |
String |
Database logging level. Possible values are: |
|
log_cmd_stats |
String |
Whether to log statistics on the executing SQL commands in PGSQL (along with the time the commands began execution). Possible values are yes to enable the logging and no to disable the logging. The statistics can be accessed using the pg_stat_activity system view in PGSQL. If set to no, PGSQL custom counters are disabled. |
Important! The PGSQL appliance will fail to start if logging is enabled and the log terminal is not connected.
The PGSQL appliance reports the following custom counters through the mon terminal, provided the log_cmd_stats property is set to yes. These counters belong to the PostgreSQL counter group:
|
Counter Name |
Description |
|
Active processes |
Number of active server processes for server |
|
Transactions committed |
Transactions committed in server |
|
Rolled back |
Transactions rolled back in server |
|
DB Block fetch requests |
Number of disk block fetch requests for server |
|
DB Block fetch hits |
Number of disk block fetch requests found in cache for server |
In case of appliance startup failure, the following errors may be logged to the system log:
|
Error message |
Description |
|
ERROR: Failed to update the postgres.conf configuration file, possibly due to low disk space on the boot volume. |
PGSQL failed to update postgres.conf configuration file. Probable cause - boot volume is full, permission problem |
|
ERROR: Unexpected internal error: missing postgres.conf.tmpl file, please contact CA Technical Support |
Template file postgresql.conf.tmpl does not exist or is unreadable, please contact CA support |
|
ERROR: Unable to access the specified log file; please check that the log_filename property contains the proper path and that the log terminal is connected. |
PGSQL failed to determine the log files directory, probable cause - log_filename value is invalid |
|
ERROR: Unable to write into the specified log file; please check that the specified log directory is writable. |
Unable to write into the PostgreSQL log file |
|
ERROR: Unknown log level has been specified for the log_level property |
The specified log_level value is invalid, it should be one of none,error,warn,notice,debug |
|
ERROR: log_cmd_stats cannot be enabled since the database is specified as read-only |
log_cmd_stats requires the database be read-write |
|
ERROR: Failed to mount the user's database volume. Please make sure the volume has been formated with a valid filesystem |
PGSQL failed to mount the specified volume with database files. Please make sure that the volume exists and is formatted with ext3 filesystem |
|
ERROR: PGSQL started in maintenance mode due to unrecognized PostgreSQL database on supplied database volume |
Specified database volume does not contain a valid database, and auto_create is set to 'no'. Appliance will start in maintenance mode |
|
ERROR: Failed to create a new database on the supplied database volume. Please see the /var/log/appliance/log file in PGSQL for more details on the failure |
PGSQL failed to empty the database directory or create a new one |
|
ERROR: Failed to start the PostgreSQL server. Please see the /var/log/appliance/log log file in PGSQL for more details on the failure |
PGSQL failed to launch the PostgreSQL server, see /var/log/pgstartup.log and /var/log/appliance/log for details |
|
ERROR: log_filename is specified but log terminal is not connected. |
The log_filename property is not empty, but log terminal of the PGSQL is not connected |
|
ERROR: log_filename is specified but log device is not mounted. |
The log_filename property is not empty, but PGSQL failed to access the logging device. The probable cause is that PGSQL started before NAS |
In cases where critical errors are encountered that may require user attention, PGSQL logs messages to the grid's dashboard as follows:
|
Message |
Description |
|
Data volume has less than 5% of free disk space |
Data volume on the PGSQL appliance has less than 5% of free disk space. It is advised to increase the size of the volume. |
|
Data volume has less than 1% of free disk space |
Data volume on the PGSQL appliance has less than 1% of free disk space. Immediate attention required; possible data loss may occur. |
These messages are logged only one time once the free disk space amount drops below the threshold.
The PGSQL performance is greatly affected by the sync_on_write, log_filename and log_cmd_stats property values. The best performance results can be achieved when the fsync, logging and statistics are all disabled (sync_on_write=no, log_filename="", log_cmd_stats=no). The table below contains sample pgbench test results (specified in tps units - transactions per second) performed when these features are enabled and disabled. pgbench is a utility that is shipped with PostgreSQL that is used to measure database performance.
|
pgbench Test configuration |
enabled |
disabled |
|
1 client, 100 requests |
40-70 tps |
650 tps |
|
10 client, 100 requests |
60-90 tps |
1100 tps |
|
100 clients, 100 requests |
70-110 tps |
1200 tps |
The following diagram shows a typical usage of the PGSQL appliance in a two-tier web application geared toward a lot of users executing simple queries:
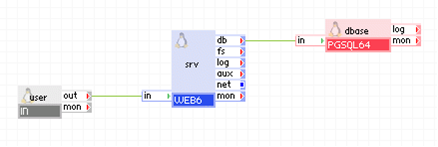
Appliances in use:
Client requests arrive on the usr gateway. The gateway forwards the requests to the web server, which serves the request. When script (for example, Perl or PHP) on srv need to access persistent data, it uses the dbase appliance through the db terminal.
In this example, the database used with dbase is not read-only and many users may access it through srv executing simple queries. As such, dbase is configured to use 256MB of memory. Also, the database does not keep any database error log files (the log terminal is not connected).
Example property configuration:
|
Property name |
Value |
Notes |
|
auto_create |
yes |
Create the database if the data volume is empty. |
|
read_only |
no |
Database is not read-only, it may be modified. |
|
query_complexity |
simple |
Users typically execute simple queries. |
|
sync_on_write |
yes |
Wait for database updates to be physically written to disk. |
Note: The data volume must also be configured on dbase and the content volume must be configured on web. To create application volumes that can be used here, see the Grid Users Guide.
The following diagram shows a typical usage of the PGSQL appliance in a two-tier web application in which the database is used to share state and data between multiple, load-balanced web servers (geared toward a lot of users executing simple queries). In addition, this example has a separate input for maintenance, through which an administrator can log in and access the database for maintenance and an input through which an administrator can log in and view the PostgreSQL error log.
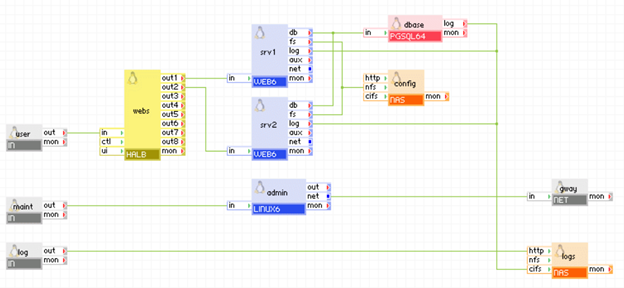
Appliances in use:
Client requests arrive on the usr gateway. The gateway forwards the requests to the webs load balancer, which directs the request to one of the web servers ( srv1 or srv2). When scripts (for example, Perl or PHP) on the web servers need to access persistent data, they use the dbase appliance through their db terminals.
The dbase database writes its error log to the logs appliance through the log terminal. In addition, an administrator can log in through the log gateway to the logs appliance and view the database error log files (as well as the web server log files).
Additionally, an administrator can log in over SSH through the maint gateway to the admin server. From the admin server, the administrator can access the dbase database for statistics or changing the database schema. The admin server can access the Internet through the gway gateway, for example, to download a newer version of libraries or the database schema.
In this example, the database used with dbase is not read-only and many users may access it through the web servers executing simple queries. As such, dbase is configured to use 256MB of memory. Also, the database is configured to keep one week of log files, one per day (after each week the log files are overwritten).
Example property configuration:
|
Property name |
Value |
Notes |
|
auto_create |
yes |
Create the database if the data volume is empty. |
|
read_only |
no |
Database is not read-only, it may be modified. |
|
query_complexity |
simple |
Users typically execute simple queries. |
|
sync_on_write |
yes |
Wait for database updates to be physically written to disk. |
|
log_filename |
dblog.%a |
Name of error log file that is to be stored on the logs data volume - one per day. |
|
log_age |
1440 |
Each log file is for one day, for example dblog.Mon. |
|
log_level |
error |
Error logging level. |
Notes:
The following diagram shows a typical usage of the PGSQL appliance in a two-tier web application implementing a decision-support system for a few users executing complex queries over a large database that is several GBs in size.
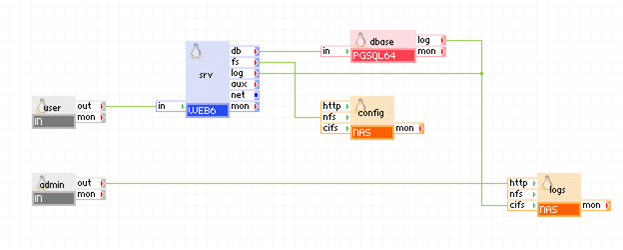
Appliances in use:
Client requests arrive on the usr gateway. The gateway forwards the requests to the srv server, which serves the request. When scripts (for example, Perl or PHP) on srv need to access persistent data, it uses the dbase appliance through the db terminal. The dbase appliance is configured to store its log files within the root directory of the share exposed by logs.
Using a browser, administrators connect to the admin gateway to view the PostgreSQL log files. The admin gateway forwards the requests to the logs NAS appliance.
In this example, the database used with dbase is not read-only and users may access it through srv executing complex queries (large queries accessing millions of rows). As such, dbase is configured to use 1536MB of memory. Also, the database is configured to keep one week of log files, one per day (after each week the log files are overwritten).
Example property configuration:
|
Property name |
Value |
Notes |
|
auto_create |
yes |
Create the database if the data volume is empty. |
|
max_connections |
25 |
Database is limited to 25 concurrent users. |
|
read_only |
no |
Database is not read-only, it may be modified. |
|
query_complexity |
complex |
Users typically execute complex queries. |
|
sync_on_write |
yes |
Wait for database updates to be physically written to disk. |
|
log_filename |
dblog.%a |
Name of error log file that is to be stored on the logs data volume - one per day. |
|
log_age |
1440 |
Each log file is for one day, for example dblog.Mon. |
|
log_level |
error |
Error logging level. |
Note: The data volume must also be configured on the dbase appliance and the data volume must also be configured on the logs appliance.
A less common usage of the PGSQL appliance is a two-tier web application using a read-only database. This is the same as the previous simple application examples except the database is read-only (no modifications are allowed). It is important to parameterize PGSQL such that it uses a read-only database as it will turn off various PostgreSQL features that are not needed for read-only databases which results in better performance (database auto-vacuuming, database modification statistics, and so on).
Example property configuration:
|
Property name |
Value |
Notes |
|
auto_create |
no |
Database on the data volume should already exist. |
|
read_only |
yes |
Database is read-only, modifications are not allowed. |
|
query_complexity |
simple |
Users typically execute simple queries. |
|
log_filename |
dblog.%a |
Name of error log file that is to be stored on the logs data volume - one per day. |
|
log_age |
1440 |
Each log file is for one day, for example dblog.Mon. |
|
log_level |
error |
Error logging level. |
PGSQL exposes properties to enable the debugging of a database by using the parameterized log file ( log_filename). For example, this is useful when you need to track SQL statements, see how long it takes to execute SQL statements, see why an SQL statement is failing, and so on. The debug information includes:
Typically to debug a database, the following properties are configured:
|
Property name |
Value |
Notes |
|
log_level |
debug |
Debug logging level. |
|
log_cmd_stats |
yes |
Log SQL command statistics (timing, processing, execution, and so on). |
The debug information is either stored in the error log accessed through the log terminal or is available through one of the PostgreSQL statistic views: http://www.postgresql.org/docs/8.3/static/monitoring-stats.html.
Be aware of the following:
The following open source 3rd party software is used in addition to that software found on the appliance base class (LUX64 is the base class of PGSQL64).
|
Software |
Version |
Modified |
License |
Notes |
|
libgcrypt |
1.4.5-9.el6_2.2 |
No |
GPLv2 |
N/A |
|
libgpg-error |
1.7-4 |
No |
GPLv2 |
N/A |
|
postgresql |
9.0.10-1PGDG |
No |
BSD |
N/A |
|
postgresql-libs |
9.0.10-1PGDG |
No |
BSD |
N/A |
|
postgresql-server |
9.0.10-1PGDG |
No |
BSD |
N/A |
|
postgresql-test |
9.0.10-1PGDG |
No |
BSD |
N/A |
|
samba-client |
3.5.10-125 |
No |
GPLv3 |
N/A |
|
samba-common |
3.5.10-125 |
No |
GPLv3 |
N/A |
|
Copyright © 2013 CA Technologies.
All rights reserved.
|
|