

|
|
|
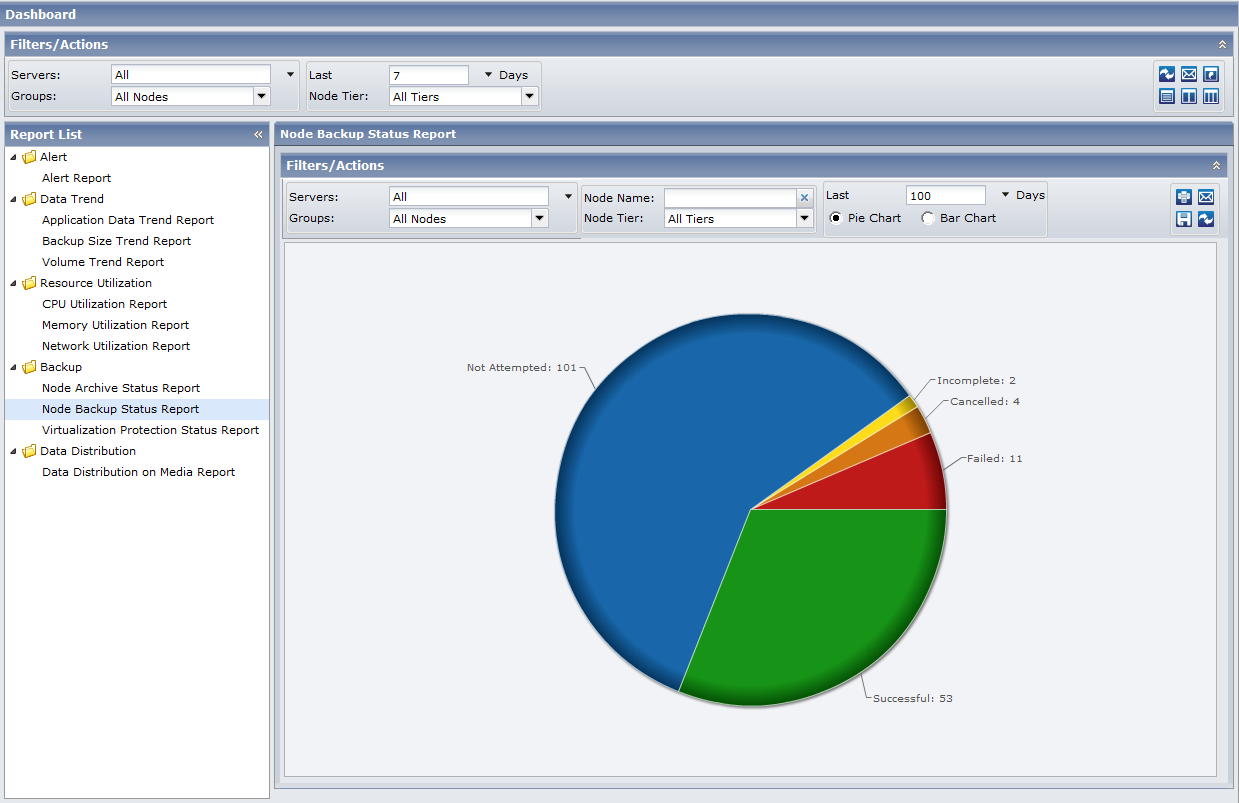
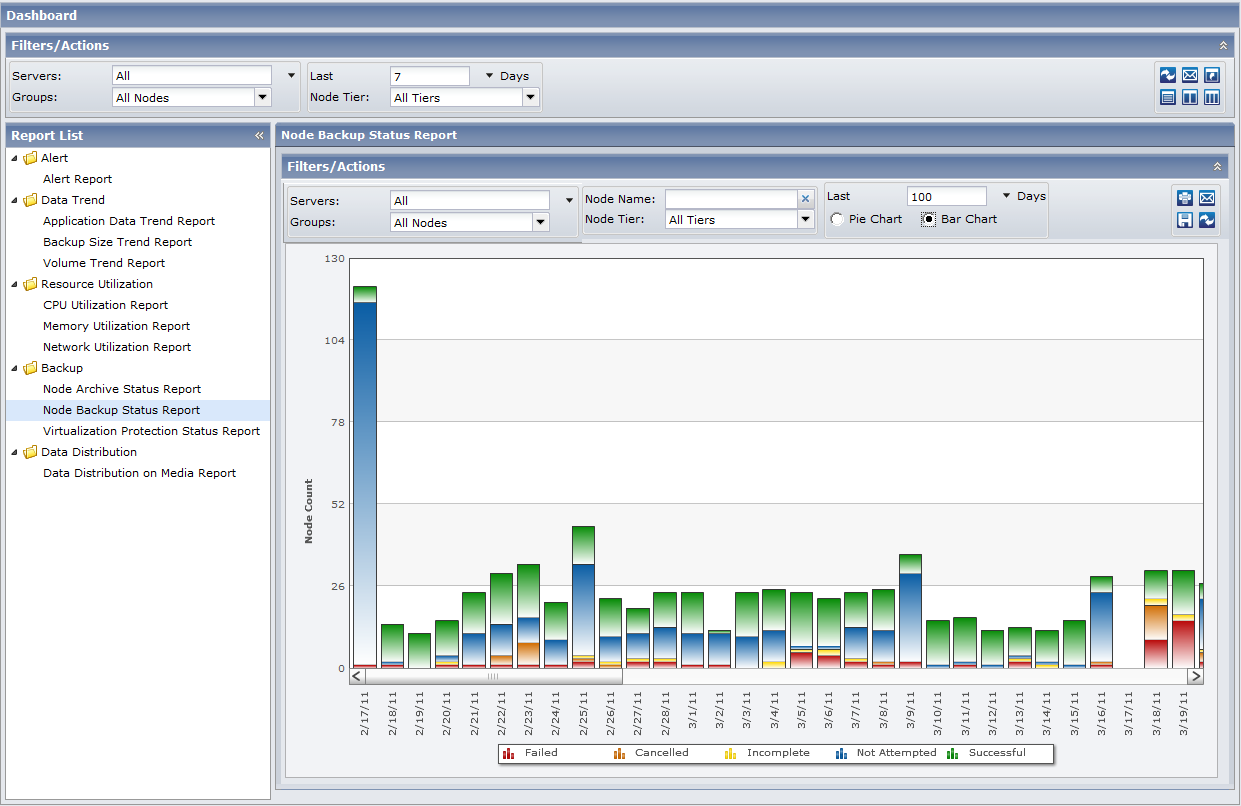
The Node Backup Status Report can be displayed as either a pie chart or as a bar chart.
This report contains the following filters:
The Node tier field contains a drop-down menu listing each tier category to select from: High Priority, Medium Priority, and Low Priority.
Note: The tier for CA ARCserve D2D nodes is Medium Priority.
Note: By default, CA ARCserve Backup only retains Activity Log information for 14 days. If you want CA ARCserve Central Reporting to display Activity Log information for more than 14 days, you must modify the "Prune activity logs older than" option to increase the log retention period. For more information about modifying Activity Log settings, see the Administration Guide.
Pie Chart
The pie chart provides a high-level overview of nodes that were backed up for all days of the specified time period. The status categories shown in the pie chart represent a percentage of the total number of nodes that were backed up during the last specified number of days, with the most recent backup status being considered for every node.
Bar Chart
The bar chart provides a more detailed level view of the nodes that were backed up for each day of the specified time period. The status categories shown in the bar chart represent the daily number of nodes that were backed up during the last specified number of days.
Note: By default, CA ARCserve Central Reporting only displays bar chart information for a maximum of 90 days. Increasing the number of displayed days to more than 90 days would result in the bar chart information not being legible. If you specify to display report information for more than 90 days, the bar chart limits the display to only 90 days, regardless of the number of days entered. This limitation does not apply to pie chart views of the same report. (The maximum number of displayed days for a pie chart is 999 days).
| Copyright © 2012 CA. All rights reserved. |
|