

The Backup Server Load Distribution Report can be displayed as either a pie chart or as a bar chart. This report contains filters for Last # Days and Backup Method.
Note: If a media is reformatted, the amount of reported data in the Backup Server Load Distribution Report does not count data from any old reformatted media.
For example, if you perform 1GB backups for seven days, the report displays a load distribution for 7GB of data. However, if you reformat the oldest media and refresh the report, the report now displays a load distribution for only 6GB of data.
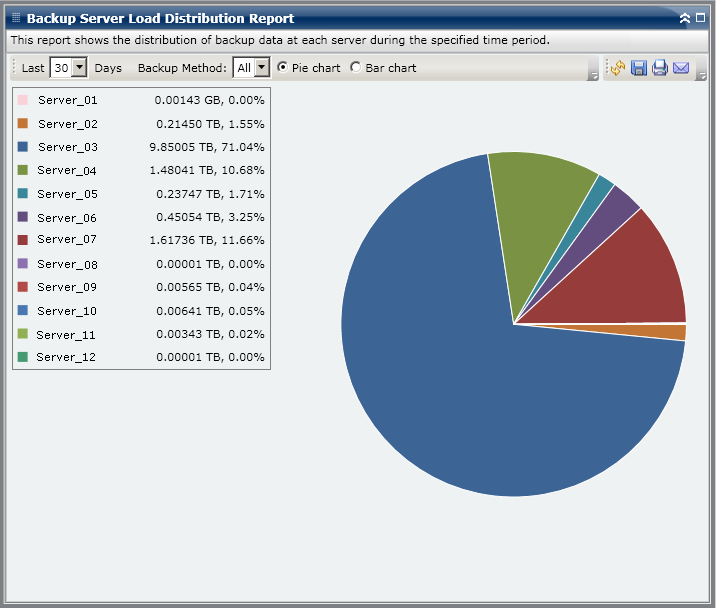
Pie Chart
The pie chart provides a high-level overview of how the backed up data is distributed between the Arcserve Backup servers for all days during the last specified number of days. The status categories shown in the pie chart represent a percentage of the total backup data distribution for those servers.
Pie chart view displays data distribution for the specified number of days for each server in TeraBytes (TB).
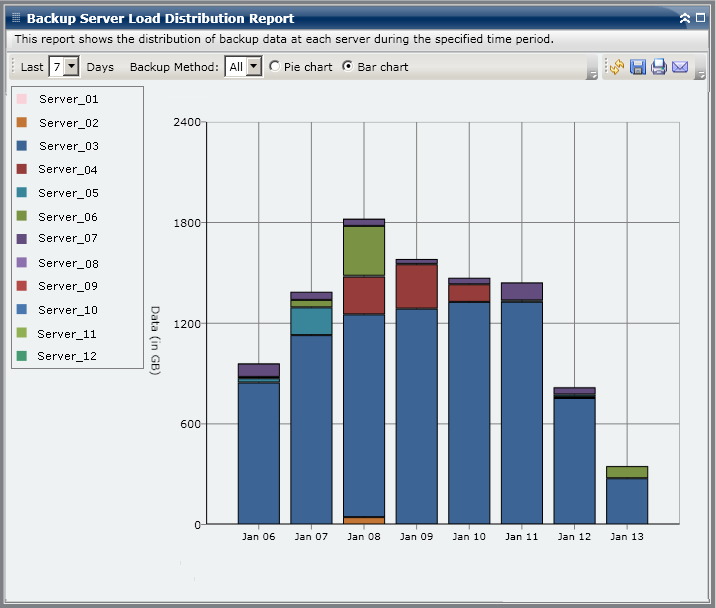
Bar Chart
The bar chart provides a detailed level view of how the backed up data is distributed between Arcserve Backup servers for each day during the last specified number of days. The status categories shown in the bar chart represent the daily backup data distribution for those servers.
Bar chart view displays data distribution for the specified number of days for each server in GigaBytes (GB).
Note: By default, Arcserve Backup Dashboard only displays bar chart information for a maximum of 90 days. Increasing the number of displayed days to more than 90 days would result in the bar chart information not being legible. If you specify to display report information for more than 90 days, the bar chart limits the display to only 90 days, regardless of the number of days entered. This limitation does not apply to pie chart views of the same report. (The maximum number of displayed days for a pie chart is 999 days).
|
Copyright © 2014 Arcserve.
All rights reserved.
|
|