

Latest version: 3.0.3-1
|
At a Glance |
|
|
Catalog |
System |
|
Category |
Monitoring |
|
User volumes |
yes |
|
Min. memory |
288 MB |
|
OS |
Linux |
|
Constraints |
no |
MON is an application monitoring appliance which collects performance and resource usage statistics (that is, counters) from other appliances within an application. Appliances report their counters to MON through the mon terminal.
MON provides a visual interface using a web browser to access and view the appliance counters. Through the visual interface, the user creates views containing one or more graphs. Each graph displays one or more appliance counters. The visual interface is accessible through the following:
See the User Interface Reference Guide for additional details on accessing and using the visual interface.
MON also supports background monitoring of appliance counters. All counters in a single view, as specified by the alarm_view property, are monitored in the background by MON. Whenever one of these counters falls below or exceeds a specified threshold, MON generates an alarm to the CA 3Tera AppLogic Grid Controller, which posts a message to the dashboard. A browser to MON's visual interface does not have to be open for MON to monitor the appliance counters in the background.
Resources
|
Resource |
Minimum |
Maximum |
Default |
|
CPU |
0.05 |
4 |
0.10 |
|
Memory |
288 MB |
2 GB |
288 MB |
|
Bandwidth |
1 Mbps |
500 Mbps |
100 Mbps |
Terminals
|
Name |
Dir |
Protocol |
Description |
|
mon |
in |
CCE |
Terminal on which performance and resource usage statistics are received. |
|
web |
in |
HTTP |
Terminal used to access and view the appliance counters. |
|
aux |
in |
Any |
Input used for programmatic collection of counters. |
The default interface is enabled. The default interface is used by the appliance to report to CA 3Tera AppLogic that it has booted successfully. It can also be used to log in over secure shell to the appliance from the CA 3Tera AppLogic controller, primarily for diagnostic and troubleshooting purposes. The default interface is used by the CA 3Tera AppLogic GUI to access the visual interface of a MON appliance.
User Volumes
|
Volume |
Description |
|
data |
Read/write, providing storage for persistent state of MON (for example, views & graphs). |
Properties
|
Property name |
Type |
Description |
|
title |
String |
Title to display in the browser windows of MON's visual interface. If empty, the application name is used. Default is empty. |
|
user |
String |
User name for web-based authentication. Authentication is only used when accessing MON through the web terminal (that is, through a gateway). There is no authentication when accessing MON's visual interface through the CA 3Tera AppLogic GUI. If empty, there is no authentication. Default is empty. |
|
password |
String |
Password for web-based authentication. This property is not used if user is empty. Default is empty. |
|
alarm_view |
String |
Name of the view containing the appliance counters to be monitored in the background. Only one view name can be specified. If empty, background monitoring is disabled. Default is empty. |
Error Messages
The following messages may appear in either the appliance log file or the system log of the grid controller when the appliance fails to start:
httpd did not start
The following counters groups are defined for all appliances:
See Creating Custom Counters on how to create and monitor custom counters in an appliance.
Monitoring Applications Through the CA 3Tera AppLogic GUI
The following diagram shows a typical usage of MON for a simple application. In this application, the monitor can be accessed through the CA 3Tera AppLogic GUI only.
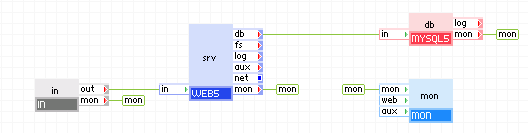
Appliances in use:
The mon terminal of all appliances are connected to the mon terminal of mon.
Monitoring Application Through Both the CA 3Tera AppLogic GUI and an IP Address on Port 80
The following diagram shows how MON can be used to access the application monitor through the CA 3Tera AppLogic GUI or through an IP address.
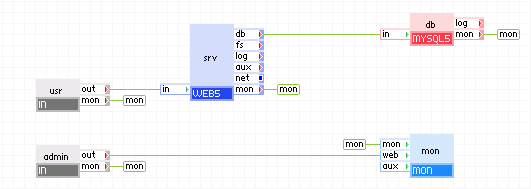
Appliances in use:
The mon terminal of all appliances are connected to the mon terminal of mon.
The out terminal of admin is connected to the web terminal of mon so users can access the monitor through the IP address specified by the ip_addr property on admin.
Monitoring Applications Through Both the CA 3Tera AppLogic GUI and an Application IP Address on Port 8080
The following diagram shows how MON can be used to access the application monitor through the CA 3Tera AppLogic GUI or through an application IP address on port 8080.
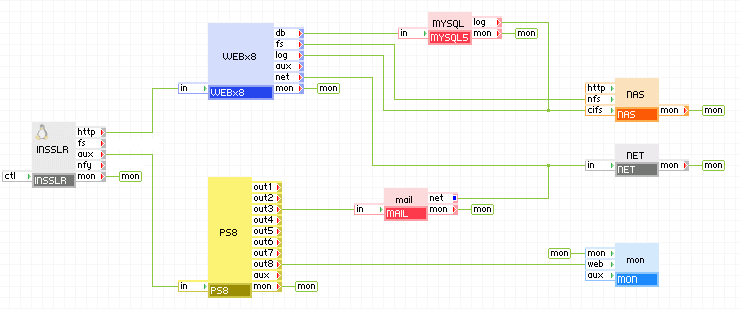
Appliances in use:
The mon terminal of all appliances are connected to the mon terminal of mon.
INSSLR is configured to forward https traffic to the WEBx8 and all other TCP traffic to the aux terminal. PS8 is configured to forward all traffic on port 8080 through out8 to the web terminal of mon. This allows users to monitor the application through the application IP address specified by the ip_addr property on INSSLR on port 8080.
Note: The MAIL appliance is not distributed with CA 3Tera AppLogic.
Background Monitoring
This use case describes how to use MON to monitor appliance counters in the background and have it generate alerts when an appliance counter is out of range.
Whenever an appliance counter falls below or exceeds the specified threshold, MON generates an alert to the CA 3Tera AppLogic Controller. A message is then logged to the dashboard specifying which counter of which appliance is out of range. For each appliance, the CA 3Tera AppLogic Controller only logs the last alert to the dashboard, however it will specify in the dashboard message if multiple alerts have been received for the appliance. All alerts are logged to /var/log/messages on the CA 3Tera AppLogic Controller.
Note: A browser to the Application Monitor does not have to be open for MON to monitor the appliance counters in the background.
To stop monitoring a specific appliance counter:
To disable background monitoring, execute one of the following:
Clear the alarm_view property on MON and restart the MON instance (or restart the application).
Data Collection Interface
Since version 1.1.3, the MON appliance provides a REST-service-like data collection API, it exports counter configuration and values in XML, JSON and UDL formats. For more details on the API, visit MonDataCollectionInterface.
Known Limitations
To monitor an application through the CA 3Tera AppLogic GUI, the name of the MON appliance in the application should be mon.
Open source and 3rd party software used inside of the appliance
|
Software |
Version |
Modified |
License |
Notes |
|
CGI.pm |
3.05 |
No |
free |
homepage on CPAN |
|
perl-CGI-Session |
4.03 |
Yes |
Perl (Artistic and GPLv2) |
homepage on CPAN |
|
perl-Carp-Assert |
0.18 |
Yes |
Perl (Artistic and GPLv2) |
N/A |
|
perl-Data-Dumper |
2.121 |
Yes |
Perl (Artistic and GPLv2) |
N/A |
|
perl-Error |
0.15 |
Yes |
Perl (Artistic and GPLv2) |
N/A |
|
perl-IPC-Run |
0.80 |
No |
Perl (Artistic and GPLv2) |
N/A |
|
cups-libs |
1.1.22-0.rc1.8.9 |
No |
LGPL with exceptions. Read LICENSE.txt file in sources. |
N/A |
|
file |
4.10-2 |
No |
BSD-like |
N/A |
|
freetype |
2.1.9-8 |
No |
FreeType License and GPLv2 |
N/A |
|
httpd |
2.0.63 |
No |
Apache license |
N/A |
|
perl-Error |
0.15-1 |
Yes |
Perl (Artistic and GPLv2) |
homepage on CPAN |
|
samba |
3.0.10-1.fc3 |
No |
GPLv3 |
N/A |
|
mod_perl |
2.0.2-6.3 |
No |
GPLv2 |
N/A |
List of Standard Appliance Counters
Overview
This document defines the list of all standard counters exported by CCA. CCA is the counter collection agent that runs in all CA 3Tera AppLogic appliances. CCA is used to report counters to the monitoring GUI exposed by the MON appliance. The availability of these counters might be limited on some of the supported appliance platforms (as stated in the counters table below). When the appliance OS supports a given counter it should be visible in the MON GUI when the appliance's mon output terminal is connected to the MON appliance.
CPU Summary
|
Counter |
Linux |
Solaris |
Windows |
|
CPU I/O Wait |
yes |
yes |
no |
|
CPU Idle |
yes |
yes |
yes |
|
CPU Irq |
yes |
no |
yes |
|
CPU Nice |
yes |
no |
no |
|
CPU Soft Irq |
yes |
no |
no |
|
CPU System |
yes |
yes |
yes |
|
CPU Total |
yes |
yes |
yes |
|
CPU User |
yes |
yes |
yes |
File System
|
Counter |
Linux |
Solaris |
Windows |
|
Allocated File Handles |
yes |
yes |
no |
|
Block Devices |
yes |
yes |
no |
|
Block Devices Unique |
yes |
yes |
no |
|
Character Devices |
yes |
yes |
no |
|
Character Devices Unique |
yes |
yes |
no |
|
Directories |
yes |
yes |
no |
|
Directories Unique |
yes |
yes |
no |
|
Fifos |
yes |
yes |
no |
|
Fifos Unique |
yes |
yes |
no |
|
Free File Handles |
yes |
yes |
no |
|
Regular Files |
yes |
yes |
no |
|
Regular Files Unique |
yes |
yes |
no |
|
Sockets |
yes |
yes |
no |
|
Sockets Unique |
yes |
yes |
no |
|
Used File Handles |
yes |
yes |
no |
Memory Statistics
|
Counter |
Linux |
Solaris |
Windows |
|
Active |
yes |
no |
no |
|
Buffers |
yes |
no |
no |
|
Cached |
yes |
no |
yes |
|
Free |
yes |
yes |
yes |
|
High Free |
yes |
no |
no |
|
High Total |
yes |
no |
no |
|
High Used |
yes |
no |
no |
|
Inactive |
yes |
no |
no |
|
Low Free |
yes |
no |
no |
|
Low Total |
yes |
no |
no |
|
Low Used |
yes |
no |
no |
|
Swap Cached |
yes |
no |
no |
|
Swap Free |
yes |
yes |
no |
|
Swap Pages IN |
yes |
yes |
no |
|
Swap Pages OUT |
yes |
yes |
no |
|
Swap Total |
yes |
yes |
no |
|
Swap Used |
yes |
yes |
no |
|
Total |
yes |
yes |
no |
|
Used |
yes |
yes |
no |
Scheduler
|
Counter |
Linux |
Solaris |
Windows |
|
Context switches |
yes |
yes |
yes |
|
Interrupts |
yes |
yes |
yes |
|
Jobs for 1 min |
yes |
yes |
no |
|
Jobs for 15 min |
yes |
yes |
no |
|
Jobs for 5 min |
yes |
yes |
no |
|
Pages IN |
yes |
yes |
yes |
|
Pages OUT |
yes |
yes |
yes |
|
Process startups |
yes |
yes |
no |
|
Processes blocked |
yes |
no |
yes |
|
Processes running |
yes |
no |
yes |
CPU#X
|
Counter |
Linux |
Solaris |
Windows |
|
CPU I/O Wait |
yes |
yes |
no |
|
CPU Idle |
yes |
yes |
yes |
|
CPU Irq |
yes |
no |
yes |
|
CPU Nice |
yes |
no |
no |
|
CPU Soft Irq |
yes |
no |
yes |
|
CPU System |
yes |
yes |
yes |
|
CPU Total |
yes |
yes |
yes |
|
CPU User |
yes |
yes |
no |
Volume X
|
Counter |
Linux |
Solaris |
Windows |
|
Bytes Read |
yes |
yes |
yes |
|
Bytes Written |
yes |
yes |
yes |
|
Disk Reads |
yes |
yes |
yes |
|
Disk Sectors Read |
yes |
yes |
no |
|
Disk Sectors Written |
yes |
yes |
no |
|
Disk Writes |
yes |
yes |
yes |
|
Free Files |
yes |
yes |
no |
|
Free Space |
yes |
yes |
yes |
|
Time Spent in Reads |
yes |
no |
yes |
|
Time Spent in Writes |
yes |
no |
yes |
|
Total Files |
yes |
yes |
no |
|
Total Space |
yes |
yes |
no |
|
Used Files |
yes |
yes |
no |
|
Used Space |
yes |
yes |
no |
Terminal X
|
Counter |
Linux |
Solaris |
Windows |
|
Recvd bytes |
yes |
yes |
yes |
|
Recvd packets |
yes |
yes |
yes |
|
Sent bytes |
yes |
yes |
yes |
|
Sent packets |
yes |
yes |
yes |
Custom Counters
Overview
Each appliance running the ccad (counter collection agent) daemon allows for custom counters to be defined and collected by 3rd party utilities. This ability is named extension interface and provides appliance creators with option to monitor appliance-specific counter data through the standard MON user interface.
Creating Custom Counters
To monitor custom counters you need to add the counters definitions to the ccad configuration and feed the actual counter values to ccad
Adding counter definitions
The custom counters have to be defined in the optional /etc/ccad.conf configuration file (in UDL format). Whenever you make changes to the configuration, the ccad daemon must be restart for the changes to take effect.
Here is a simple example configuration:
counters Apache
   {
   pace = 1000
   pipe = /tmp/cca
   counter Total_Accesses
      {
      name        = "Total hits"
      desc        = "Total number of hits"
      units       = "#"
      type        = "MAX"
      }
   counter Total_kBytes
      {
      name        = "Total bytes"
      desc        = "Total number of bytes"
      units       = "bytes"
      type        = "MAX"
      }
   counter BusyWorkers
      {
      name        = "Active requests"
      desc        = "Number of active requests"
      units       = "#"
      type        = "MAX"
      }
   counter IdleWorkers
      {
      name        = "Idle servers"
      desc        = "Number of idle servers"
      units       = "#"
      type        = "MAX"
      }
   }
This example defines 4 counters. Each counter entity supports the following attributes:
The root-level counters entity's name is used for Entity name when the counters are later shown in MON. Additionally, the following attributes are meaningful for this entity:
In addition to counter definition method described above, ccad.conf allows counters to be grouped together. This is achieved by placing them one level deeper in group entities as in the following example:
counters Plants
   {
   pace = 2000
   pipe = /my-pipe
   counter tree: desc = "Any tree" , units = "#"
   group Fruits
      {
      desc = "Delicious Fruits!!!"
      counter pears : desc = "Number of pears"   , units = "pears"
      counter apples: desc = "Number of apples"  , units = "apples"
      }
   group Vegetables
      {
      counter potato: desc = "Number of potatoes", units = "potatoes"
      counter tomato: desc = "Number of tomatoes", units = "tomatoes"
      }
   }
This configuration would produce 3 custom counter entities in MON's GUI - Plants, Delicious Fruits!!! and Vegetables with the 5 defined counters distributed among them. Groups support a desc attribute (just like counter entities) that can be used to define a richer group name as opposed to the more constrained group entity name. Counter names should be unique across the configuration file otherwise the counter collection would be made impossible for the duplicate counter names.
Feeding counter data
Once you have the ccad running with the proper counter definitions, you need to feed the actual counter values. To do so, write the counter values to the named pipe create by ccad (specified by the pipe attribute in /etc/ccad.conf, default /tmp/cca).
The proper format is one of the following:
counter = value (name and value are separated with =)
counter : value (name and value are separated with :)
A counter set should be flushed (to MON) by printing . or form feed character (\f) in the named pipe on a line by itself. A counter collection script (in Bash) could do the following to feed counter to ccad:
echo "Total_Accesses = 31" > /tmp/cca
echo "Total_kBytes = 22241" > /tmp/cca
echo "BusyWorkers = 6" > /tmp/cca
echo "IdleWorkers = 34" > /tmp/cca
echo "." > /tmp/cca
This should be done every pace milliseconds as specified in /etc/ccad.conf
Here is a simple bash loop that would collect the needed data and feed it to ccad. We feed more data than we need as it faster to give all the collected data to ccad (which will ignore the lines that are not counter values) than to parse the data before feeding it to ccad:
while true; do
   curl -s http://in/server-status?auto | sed "s/^Total\ /Total_/g" > /tmp/cca # this parses the data so it matches out counter definitions
   sleep 1 || exit 4
   echo "." > /tmp/cca
done
Examples
Windows Example
The following Windows custom counter example uses Perl. To install the Perl Win32 package on a managed Windows appliance if it is not already present:
The following is the code example:
#!/bin/perl
use Win32::Pipe;

my $defaultPace=1000;
my $defaultPipe="\\\\.\\pipe\\cca";
my $ccadConf="/etc/ccad.conf";

sub get_value_from_config
   {
   open(F, $ccadConf) || die "can't open $ccadConf: $!\n";
   while(<F>)
      {
      #($name, $value) = split('=');
      my $row=$_;
      $row =~ m/^\s*(\w+)\s*=\s*(.*)\s*$/;
      if ($_[0] eq $1)
         {
         close F;
         return $2;
         }
      }
   close F;
   return "";
   }

my $cfgPace = &get_value_from_config("pace");
my $cfgPipe = &get_value_from_config("pipe");
if ($cfgPace eq "") { $cfgPace = $defaultPace; }
if ($cfgPipe eq "") { $cfgPipe = $defaultPipe; }
else { $cfgPipe = "\\\\.\\pipe\\".$cfgPipe; }

my $pipe;
$pipe = new Win32::Pipe($cfgPipe) || die "can't connect to pipe\n";
$pipe->ResizeBuffer(4096);

# this loop feeds a counter named Test with a value which increments on each iteration
my $val = 0;
while (1)
  {
   $val ++;
   my $str = "Test = $val\n.";
   $pipe->Write( $str );
   sleep( $cfgPace / 1000 );
   }
Linux Examples
Apache
Note: The server must have 'extended status' enabled.
#!/bin/bash
DEFAULT_PACE=1000
DEFAULT_PIPE=/tmp/cca
CCAD_CONF=/etc/ccad.conf
STATUS_URL='http://in/server-status?auto'
CURL=/usr/bin/curl
SED=/bin/sed
SLEEP=/bin/sleep
function get_value_from_config {
   CONF_VALUE=`grep -oE "$1[[:space:]]*=[[:space:]]*[^[:space:]]+" $CCAD_CONF |cut -d"=" -f 2|tr -d " "`
}
get_value_from_config "pace"
PACE=${CONF_VALUE:-$DEFAULT_PACE}
PACE=$(( $PACE / 1000 ))
get_value_from_config "pipe"
PIPE=${CONF_VALUE:-$DEFAULT_PIPE}
test -p $PIPE || exit 3
while true; do
   $CURL -s "$STATUS_URL" | $SED "s/^Total\ /Total_/g" > $PIPE
   sleep $PACE || exit 4
   echo "." > $PIPE
done
Mysql
#!/bin/bash

DEFAULT_PACE=1000
DEFAULT_PIPE=/tmp/cca
CCAD_CONF=/etc/ccad.conf
MYSQL='/usr/bin/mysql'
TR=/usr/bin/tr
SLEEP=/bin/sleep
function get_value_from_config {
   CONF_VALUE=`grep -oE "$1[[:space:]]*=[[:space:]]*[^[:space:]]+" $CCAD_CONF |cut -d"=" -f 2|tr -d " "`
}
get_value_from_config "pace"
PACE=${CONF_VALUE:-$DEFAULT_PACE}
PACE=$(( $PACE / 1000 ))
get_value_from_config "pipe"
PIPE=${CONF_VALUE:-$DEFAULT_PIPE}
test -p $PIPE || exit 3
while true; do
   $MYSQL -e 'show status'|$TR '[[:blank:]]' '=' > $PIPE
   $SLEEP $PACE || exit 4
   echo "." > $PIPE
done
Counter Collection Web Service API
Monitoring API Overview
The MON appliance exports counter data and configuration collected from connected appliances on its aux output terminal. This is done via custom REST-based protocol, running over HTTP. This protocol defines 3 types of resources:
Each of these types is embedded into the scope of the previous. That is, entities have only meaning in the scope of appliances and counters are only meaningful in the scope of a particular entity. The data collection API allows for retrieving all counter configurations and values known to MON.
MON exports requested data configuration and values in any of the following structured text formats:
JSON (meant for JavaScript-enabled browser clients)
Monitoring API Protocol
The protocol only uses the GET HTTP method, as it only provides reading functionality. Thus, every supported type of protocol request can be defined by means of its URI and the output structure. Characters, that are considered special for the URI should be escaped using the standard %-encoding. We define the output by its XML schema (primary output format is XML). Translation into other output formats (UDL, JSON) is achieved by direct usage of the respective output format's means of expressing structure and attributes (for example UDL entities v.s. XML entities, UDL attributes v.s. XML attributes, JSON objects v.s. XML entities, JSON object properties v.s. XML attributes).
The root node of all outputs contains a timestamp attribute which provides the server time at the moment when the response was created.
The following is a description of all supported URLs (calls).
Counter Configuration Calls
/monapi/desc[?fmt=<format>]
Returns a list of all available appliances in a specified output format (<format> is one of the known output formats, e.g. xml).
Output:
<response timestamp="1194967464">
   <appliance name="main.web" />
   <appliance name="main.in" />
</response>
/monapi/desc/<apps>[?fmt=<format>]
Returns a list of all available entities within the requested appliances (<apps>). <apps> might be a single appliance name, a comma-separated list of appliance names or a wildcard character (*) meaning all available appliances.
Output:
<response timestamp="1194967464">
   <appliance name="main.web">
      <entity name="Terminal in" />
      <entity name="Terminal out" />
      <entity name="Volume data" />
      <entity name="CPU" />
      <entity name="Memory" />
      <entity name="Network" />
   </appliance>
</response>

/monapi/desc/<apps>/<ents>[?fmt=<format>]
Returns a list of all available counters within the requested appliance entities (<ents>). <ents> might be a single entity name, a comma-separated list of entities names or a wildcard character (*) meaning all available entities. Same for <apps>.
Output:
<response timestamp="1194967464">
   <appliance name="main.web">
      <entity name="Terminal in">
         <counter name="Sent bytes" />
         <counter name="Received bytes" />
      </entity>
   </appliance>
</response>

/monapi/desc/<apps>/<ents>/<cnts>[?fmt=<format>]
Returns the descriptions of requested counters (<cnts>). <ents>, <ents> and <ents> might be a single appliance/entity/counter, a comma-separated list of such or wildcard.
Output:
<response timestamp="1194967464">
   <appliance name="main.web">
      <entity name="Terminal in">
         <counter name="Sent bytes" description=""  units=""  alarm_below="" alarm_above="" range_lower="" range_upper="" pace="" />
         <counter name="Received bytes" description=""  units=""  alarm_below="" alarm_above="" range_lower="" range_upper="" pace="" />
      </entity>
   </appliance>
</response>
Counter Value Calls
/monapi/val/<apps>/<ents>/<cnts>[?fmt=<format>]
Returns the values of the specified counters. If any of the app, ent or cnt parameters are omitted, wildcard value is assumed. Thus, for example, /monapi/val/main.web would mean "the values of all counters in all entities of appliance main.web".
Output:
<response timestamp="1194967464">
   <appliance name="main.web">
      <entity name="Terminal in">
         <counter name="Sent bytes" value="23234" />
         <counter name="Received bytes" value="690432" />
      </entity>
   </appliance>
</response>
|
Copyright © 2011 CA.
All rights reserved.
|
|