The SiteMinder OneView Monitor identifies performance bottlenecks and provides information about resource usage in a SiteMinder deployment. It also displays alerts when certain events, such as component failure, occur. It does this by collecting operational data from the following SiteMinder components:
As these components are added to a SiteMinder deployment, they are automatically registered with OneView Monitor. You do not need to configure OneView to monitor these components.
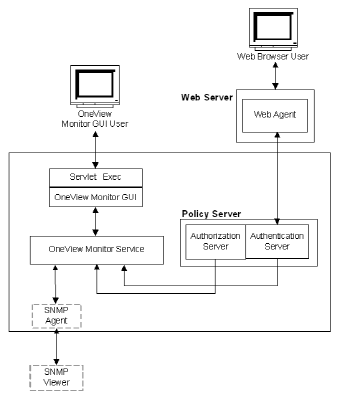
Each machine that hosts a monitored component includes a OneView agent. The agent sends operational data to the OneView Monitor, which resides on the machine where the Policy Server is installed. The OneView Monitor sends the operational data to a Web browser or (optionally) an SNMP agent. The SNMP agent sends the data to the SNMP manager.
OneView Monitor data can be accessed from a Web browser, or from a third-party SNMP monitoring application.
The following graphic illustrates how the OneView Monitor is integrated in a SiteMinder deployment.

The OneView Monitor collects properties, such as the IP address of the component's host machine, and counters that reflect a component's activity, such as how many times users have logged into your site. Counters are reset when the component is restarted.
Using the Web-based OneView viewer, administrators can define tables to view some or all of the data for a specific component. The data is refreshed at configurable intervals.
SNMP support enables monitoring applications to retrieve operational data from the OneView Monitor. SNMP support includes a Management Information Base (MIB) and an SNMP agent.
Note: In an environment that includes a clustered Policy Servers, you can specify a single OneView Monitor to monitor activity on all Policy Servers in a cluster. To configure a central monitor, you must adjust the OneView Monitor settings in the Policy Server Management Console for each Policy Server in the cluster.
| Copyright © 2010 CA. All rights reserved. | Email CA about this topic |