You can use the Presentation menu to choose the way data is presented in a drilldown Interface report.
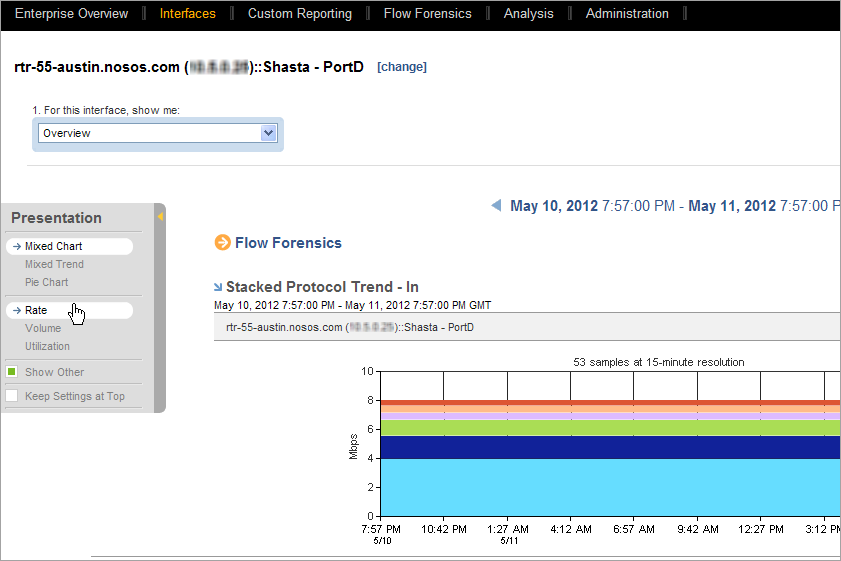
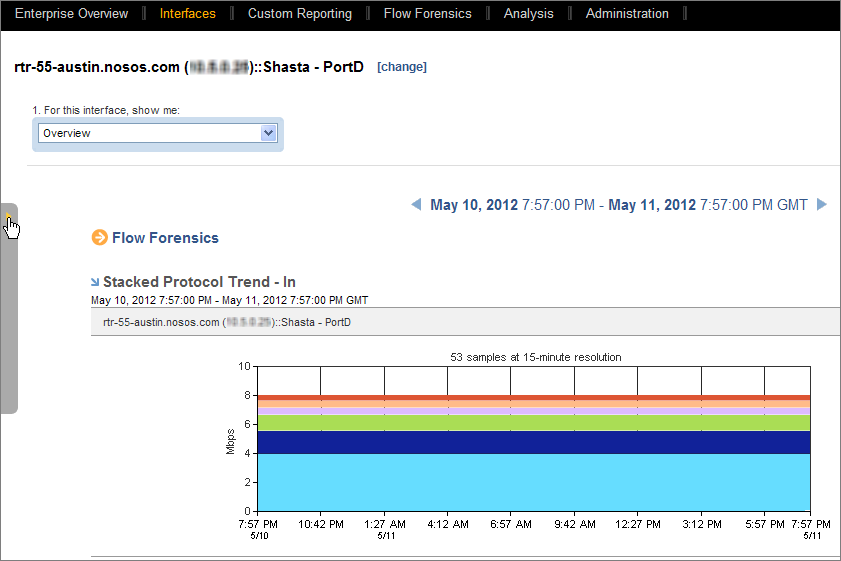
To open the Presentation menu, click the gray bar on the left edge of the page, as illustrated in the following example.
The Presentation menu opens and gives you access to the options that are appropriate for the selected report type. The display options in the top part of the menu may include a one of the following report types:
The selected presentation format determines which metric options are available. For example, if you choose a trend plot as the display type, you can choose rate, volume, or utilization for the metric.
Keep Settings at Top: As you scroll up or down the page, the Presentation menu moves to remain in view by default. To position the Presentation menu in a fixed position at the top of the page, select Keep Settings at Top.
Display options determine the presentation of the data in the report views. Each Interface report has a default display type, but you can use the Presentation options to change the display type. The display types that are available depend on the report.
Overview
Growth Report
Utilization
Interface reports support the display of rate, volume, and utilization metrics. The metrics available for the report depend upon the type of data included in the report, and sometimes the selected display option.
When you display a Top-N report for protocols, hosts, and conversations, you can include data for items other than the top ten. To include the other items, select the Show Other check box in the Presentation options. The data for the other protocols, hosts, or conversations is then rolled up and assigned a label of Other.
| Copyright © 2013 CA. All rights reserved. |
|