The Enterprise-Wide Correlated Anomalies table summarizes the anomalous behaviors that are most likely to be malicious or damaging to the network.
This view shows anomaly clusters that occurred during the reporting time frame. Anomaly clusters are better indicators for problems than single anomalies. Many types of intrusions or attacks involve multiple instances of anomalous network behavior. Instances are often clustered around a group of a few hosts at first, then the behavior spreads. This view identifies network locations to begin investigating if you suspect malicious activity.
An anomaly is correlated when the following requirements are met:
Correlation is useful because many attacks on networks and components display a fan-out behavior, which affects seemingly unrelated devices and produces unexpected traffic from multiple sources. Correlation is performed according to an algorithm that considers the typical patterns for each type of monitored network traffic.
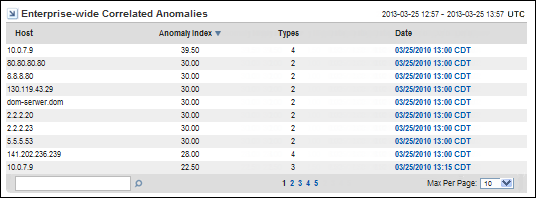
The Enterprise-Wide Correlated Anomalies view provides the following information about anomalous network behavior:
The IP address of the host that displays the anomalous behavior. The host may be a client computer, a server, a router, or a router interface. The program attempts to resolve the hostname of any IP address and displays that name in the Host field.
The count of the anomalies in the cluster, weighted by their role as either primary and secondary. The higher the index number, the more severe the issue.
The number of different types of anomalous network behavior during the reporting period.
The date and time of the first correlated anomaly on the host. Click the Date link to jump to the Anomaly Drill-in page.
Click a Date link to jump to the Anomaly Drill-In page, which contains a table that describes the corresponding anomalies. Click the links in the Anomaly Drill-In page table to view additional reports:
The time may vary by up to 15 minutes from the time when the flows actually took place. Data is pulled from the Harvesters for analysis at 15-minute polling intervals.
| Copyright © 2013 CA. All rights reserved. |
|