

|
|
|
The data in the Stacked AS Trend views helps you determine the usage of numbered routes in a network. Use this AS (Autonomous System) Next Hop data to troubleshoot issues.
Click the name of an AS number in the legend to display an AS Next Hop Summary Table specific to that AS number.
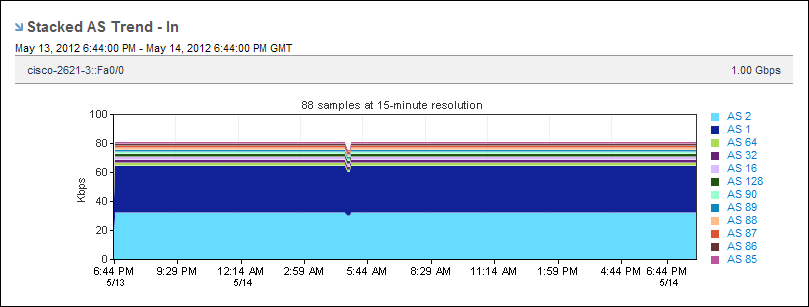
The Stacked AS Trend views display data for the top 10 AS numbers on the interface. To display data for AS numbers other than the top ten, select Show Other in the Presentation menu. Data for AS numbers other than the top ten is rolled up and assigned a label of Other.
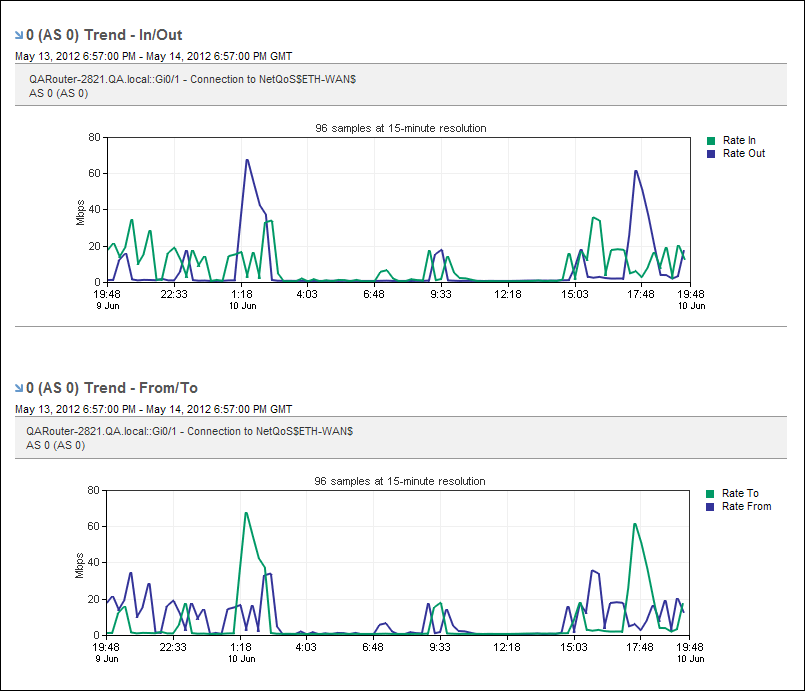
Change the presentation display to a trend chart to display each AS number as an individual trend plot. A trend chart is useful for comparing the inbound and outbound AS number data patterns.
| Copyright © 2012 CA. All rights reserved. | Tell Technical Publications how we can improve this information |