

|
|
|
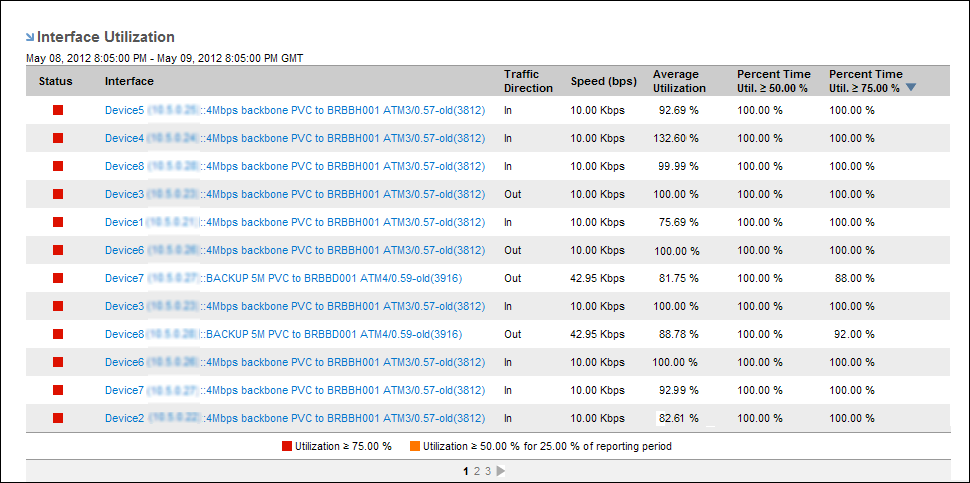
The Interface Utilization view on the Enterprise Overview page lists the most heavily used interfaces throughout the enterprise. The view is a table summary of the interfaces whose utilization exceeds the configured thresholds.
The Interface Utilization view is similar to the Interfaces Over Threshold view on the CA Performance Center Infrastructure Overview page.
The Interface Utilization view displays the following information for each interface listed:
Indicates utilization level: Green (Normal), Orange (Warning or Elevated), Red (Critical).
Identifies the interface by name.
Identifies whether the reported traffic is inbound or outbound.
Lists the speed that is set for the interface by the Administrator.
Lists the percentage of total utilization of the interface on average.
Percentage of the time that interface utilization meets or exceeds the Warning level. The default Warning level is 50 percent utilization for 25 percent of the reporting period. The Interface Utilization list contains only the interfaces that meet the Warning level. If an operator changes this setting, the contents of the interface list may change.
Percentage of the time that interface utilization meets or exceeds the Critical level. The default Critical level is 75 percent utilization of the interface capacity for 25 percent of the reporting period. The operator can change the Critical level.
A description of the criteria that determine which interfaces are displayed and what the status icons represent. In the example, the icons are defined as follows:
Information about changing the utilization thresholds is in Configure the Display of Interface Utilization Data.
| Copyright © 2012 CA. All rights reserved. | Tell Technical Publications how we can improve this information |