

|
|
|
The data in Stacked Protocol Trend views helps you determine which type of traffic is consuming bandwidth on the interface. These views also show the way bandwidth consumption changed over the selected time period.
Click the name of a protocol in the legend to display a protocol report with interface data specific to that protocol.
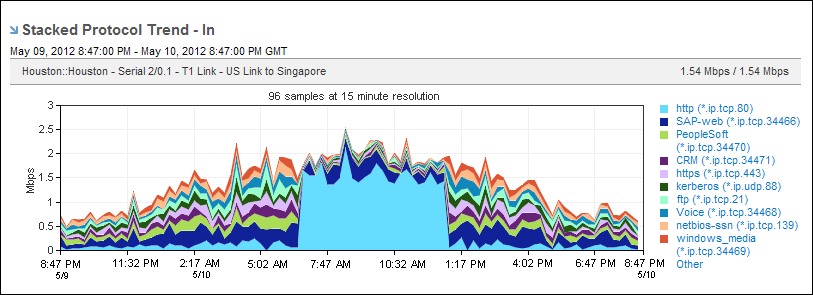
The Stacked Protocol Trend views display data for the top ten protocols on the interface. To display data for protocols other than the top ten protocols, select Show Other in the Presentation menu. Data for protocols other than the top ten is rolled up and assigned a label of Other.
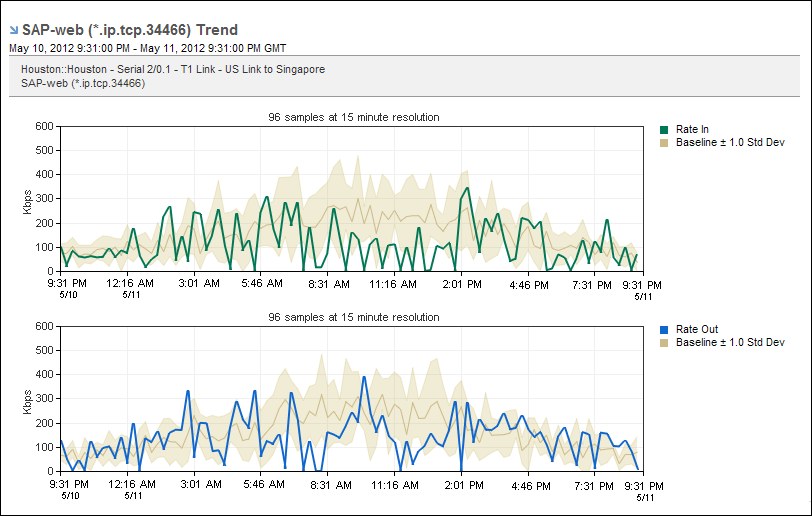
Change the presentation display to a trend chart to display each protocol as an individual trend plot. A trend chart is useful for comparing the protocol data patterns against a baseline.
| Copyright © 2012 CA. All rights reserved. | Tell Technical Publications how we can improve this information |