

|
|
|
The Top Conversations (Pie) view includes a pie chart representation of the conversations that account for the most traffic on the selected interface.
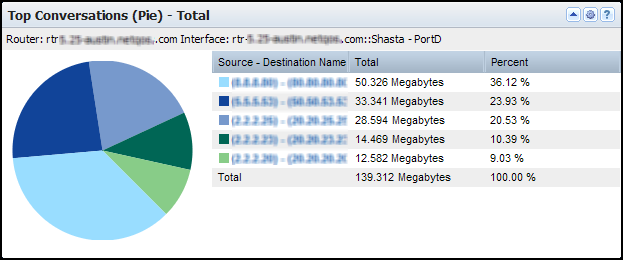
The view includes a pie chart and table of information about the high-volume conversations on the selected interface. A text string near the top of the view identifies the interface whose data is displayed. The table includes the following information by default:
Identifies the host servers that initiated and received the conversation data by their names or IP addresses.
Records the total amount of data that was exchanged in the conversation (for example, in number of megabytes).
Measures the percentage of the total data that was generated by the conversation.
By default, views and reports show the most recent 24 hours of data.
To see the Top Conversations (Pie) views in CA Performance Center, go to one of the following locations:
Available Actions for This View
You can perform several actions in this view, including the ones in the following list:
Find Conversation Pie Charts in the NFA Console
You can display conversation pie charts in the NFA console for any interface you have selected:
View: Conversations Summary (Total) for the Top N Conversations, plus other overview views.
View: Conversations Summary (Total) for the Top N Conversations.
View: Protocol Conversations Summary (Total) for a single protocol.
View: ToS Conversations Summary (Total) for a single ToS.
To display Flow Forensics-level detail, click the Flow Forensics link and run a Flow Forensics report.
| Copyright © 2012 CA. All rights reserved. | Tell Technical Publications how we can improve this information |