

|
|
|
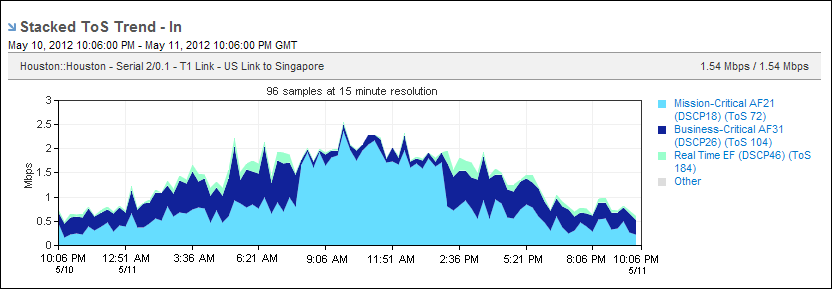
The data in Stacked ToS Trend views helps you determine the amount of traffic on the interface by ToS designation and its change over the selected time period.
Click the name of a ToS in the legend to display the ToS report with interface data specific to that ToS.
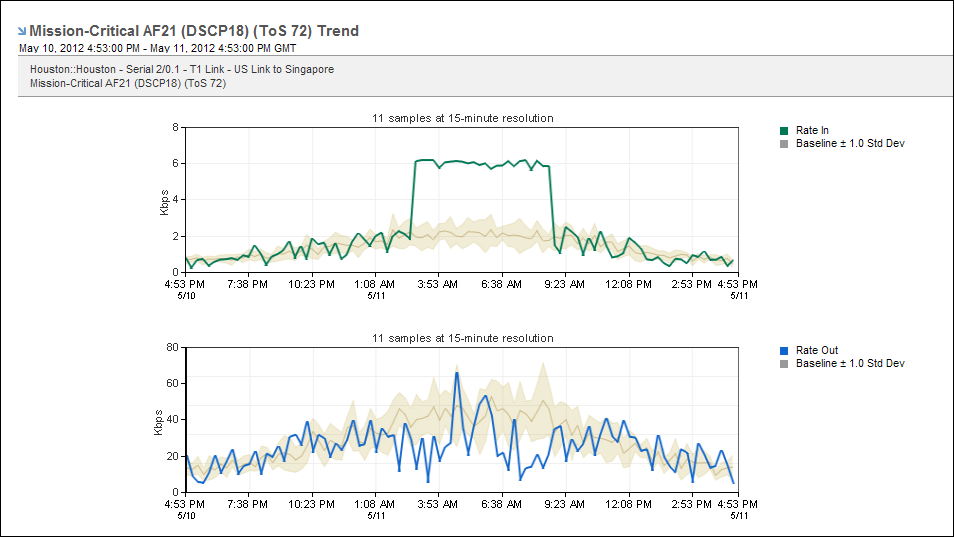
Change the presentation display to a trend chart to display each ToS as an individual trend plot. A trend chart is useful for comparing the ToS data patterns against a baseline.
| Copyright © 2012 CA. All rights reserved. | Tell Technical Publications how we can improve this information |