The EE Traffic Explorer uses data collected from the Packet Analyzer to graph EE traffic throughput.
You can use the TIME command to graph traffic for the following time frames:
The relative size of each bar in the graphs indicates a proportion or percentage of all cumulative traffic.
You can perform various functions from the EE Traffic Explorer, for example:
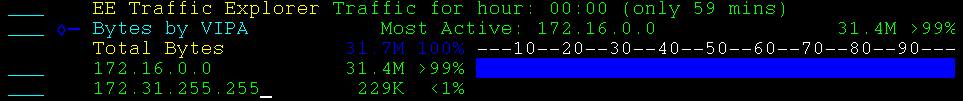
Bytes by VIPA totals the bytes sent and received over all EE connections that a specified VIPA.
Note: One VIPA can support one or many connections.
Example: Bytes by VIPA
The following example shows an expanded display.
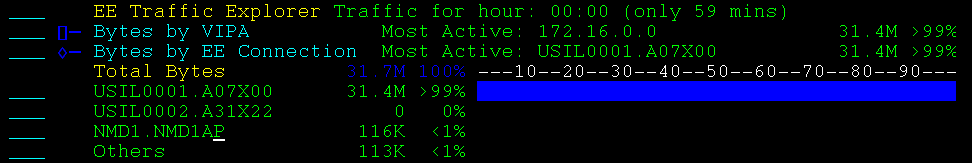
Bytes by EE Connection totals the bytes sent and received by all RTP Pipes, for all traffic priorities, on a specified EE Connection.
The EE connection is identified by its remote CP name.
Example: Bytes by EE Connection
This example shows an expanded display listing the remote CP names that identify the connections.
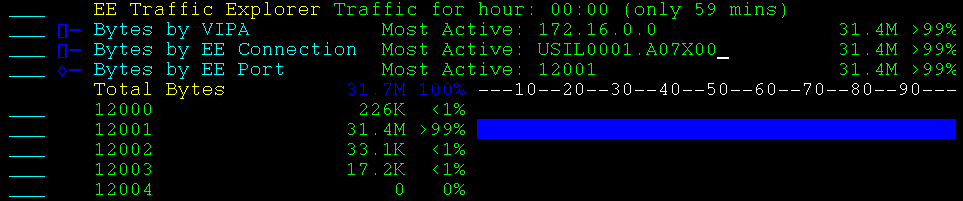
Bytes by EE Port totals the bytes sent and received over each EE port.
Example: Bytes by EE Port
This example shows an expanded display.
Bytes by Protocol Layer totals the bytes sent and received over all EE connections by the following protocols:
Contains addressing and control information.
Contains source and destination port information.
Use this option to establish the connection, send data as NLPs, terminate the connection, send a negative response, and send a heartbeat.
Used to route NLPs (network layer packets) from one RTP end point to the other.
Identifies the RTP pipe.
Identifies the SNA LU-LU session.
Identifies the type of data in the RU.
Specifies the data sent by the SNA application. An RU is an SNA command and response, or user data.
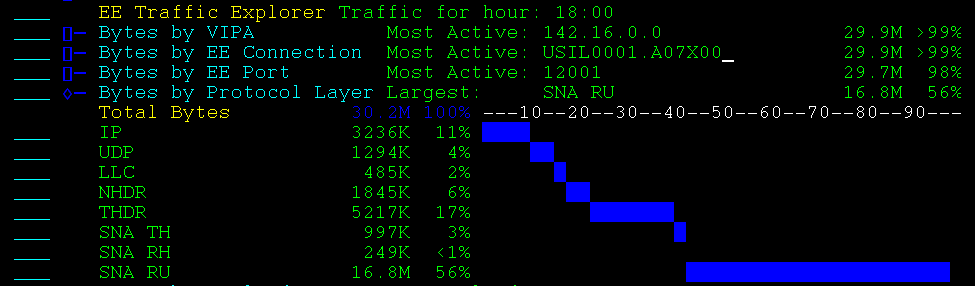
Example: Bytes by Protocol Layer
This example shows an expanded display. The protocol layer with the largest number of bytes transferred is SNA RU.
Bytes by payload shows the ratio of payload to total transmission over all EE connections. This display shows the following payload types:
Displays the overhead EE requires to send the APPN/HPR data.
Displays the overhead that APPN/HPR requires to send the SNA application data.
Displays the SNA application traffic.
Note: It is normal EE operation for the proportion of payload to overhead to vary with the traffic load.
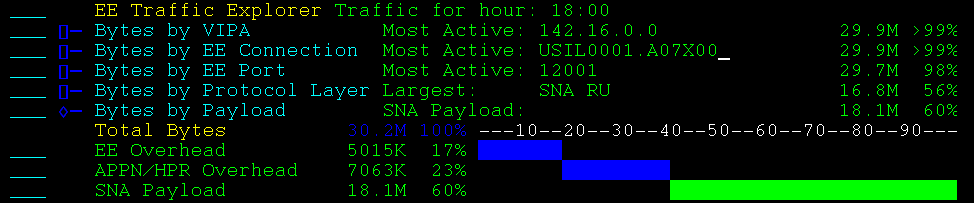
Example: Bytes by Payload
This example shows an expanded display. SNA data is 60% of the total traffic.
Bytes by Direction totals the bytes sent and received over all EE connections.
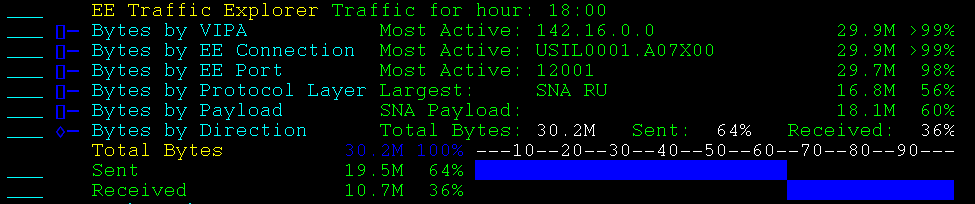
Example: Bytes by Direction
This example shows an expanded display. More bytes have been sent than received.
Packets by type totals the packets sent and received into the following types:
Specifies an LLC TEST frame, sent by the EE connection endpoints to check whether the connection is active.
Specifies LLC XID frames, which are exchanged by the endpoints to negotiate and confirm the configuration of a new EE connection.
Specifies an HPR control packet, which is an NLP with no NLP data.
Specifies an SNA packet, which includes at least one SNA TH, RH, or RU.
Specifies LLC frames, other than XID or TEST, and function routing NLPs.
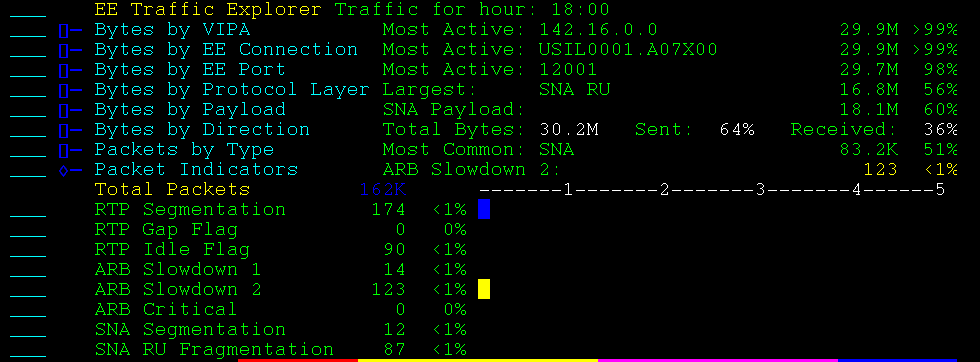
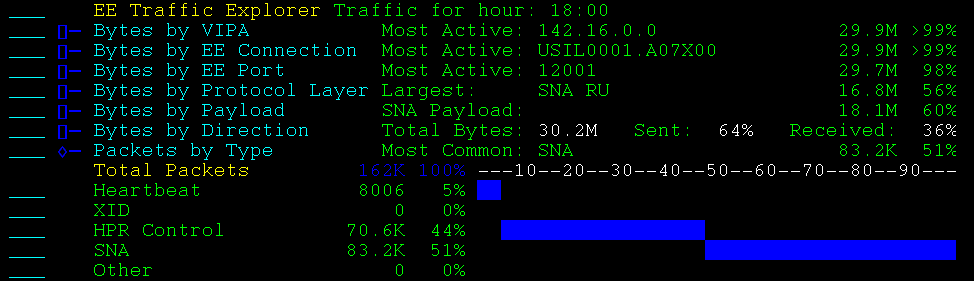
Example: Packets by Type
This example shows an expanded display. SNA is the most popular packet type.
Packet indicators shows the total packets grouped by the transmission header control settings. The values are independent of each other and do not add up to 100%.
Example: Packet Indicators
This example shows an expanded display.