You can display performance graphs from the following locations through attribute lists:
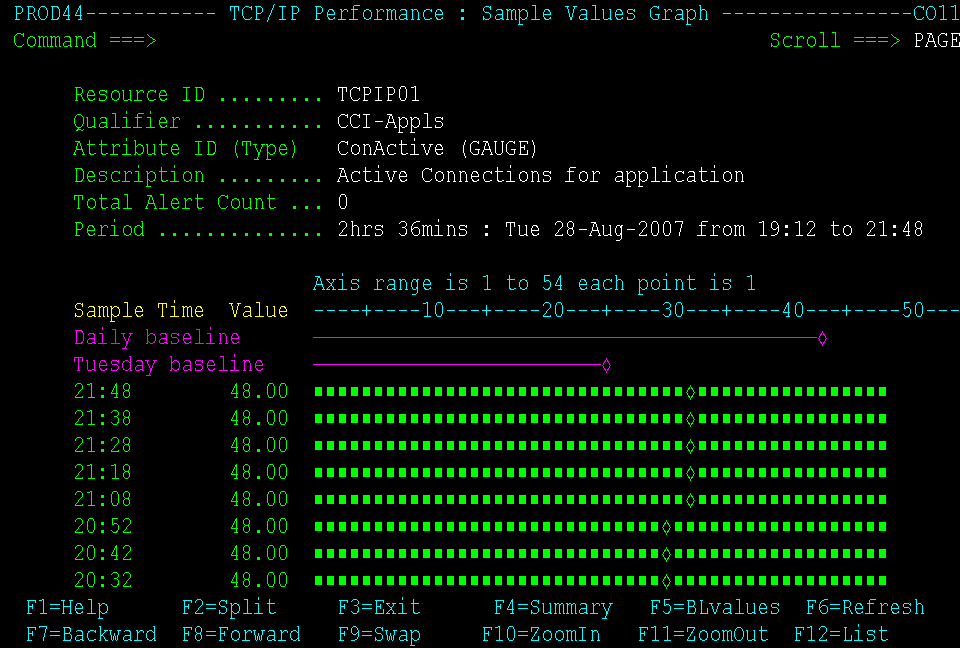
To display the sample values graph, enter D (Samples) beside an attribute of the Gauge or Enumerated type on the Attribute List.
Example
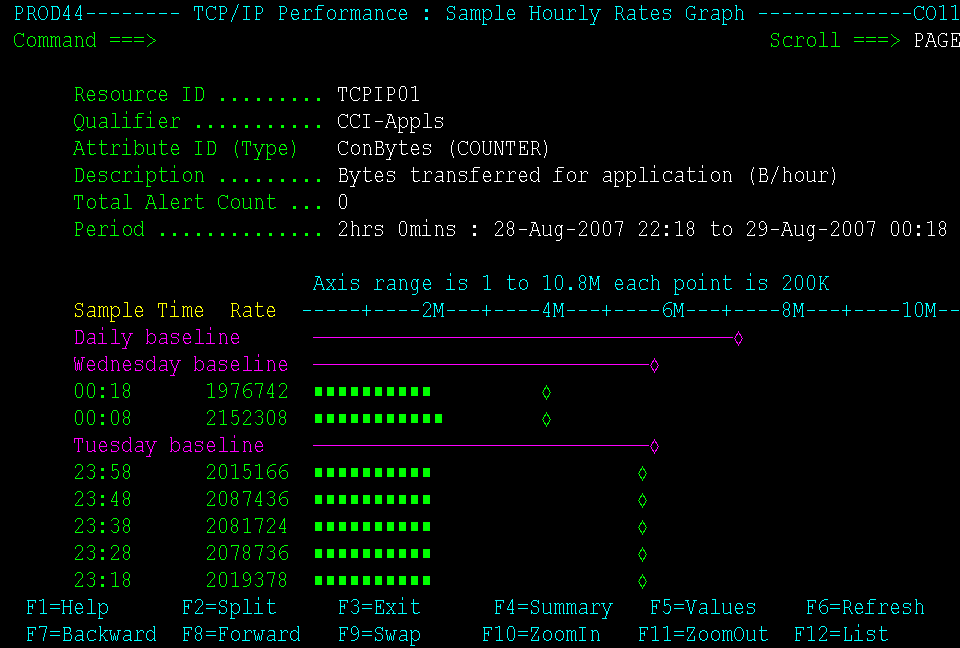
To display the sample hourly rates graph, enter D (Samples) beside an attribute of the Counter or Total type on the Attribute List.
Example
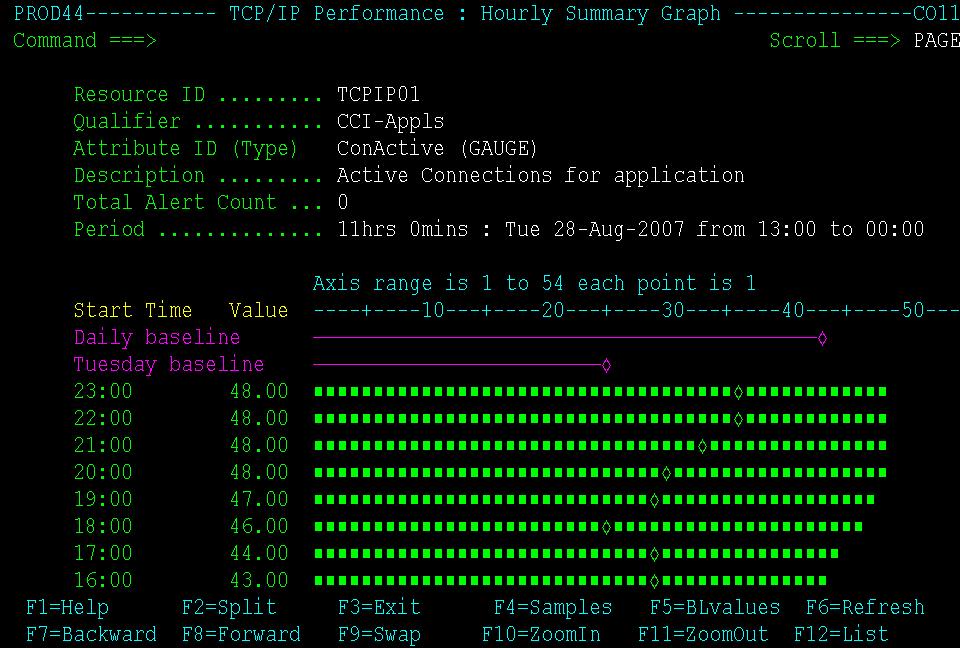
To display the hourly summary graph, enter S (Summary) beside an attribute on the Attribute List.
Example