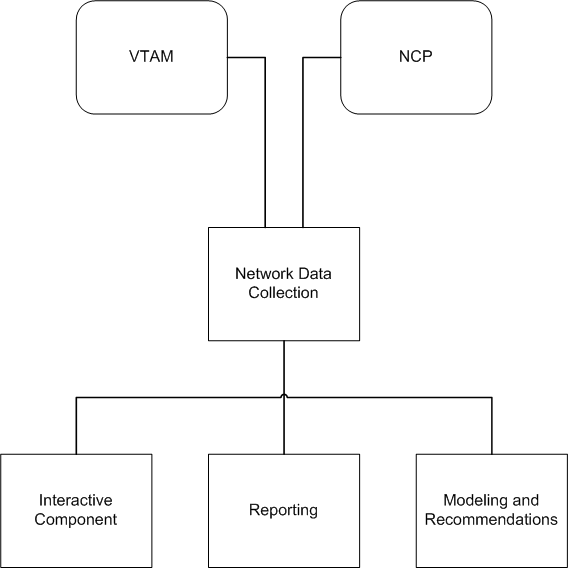
CA NetSpy comprises the following components:
The following illustration shows the relationship between the components:
Network Data Collection continuously monitors the network and collects performance data. This data reflects current and historical activity of the network. Network Data Collection sorts the data and stores it in an SMF file or a log file.
Network Data Collection has the following interfaces:
The following diagram shows Network Data Collection's interfaces.
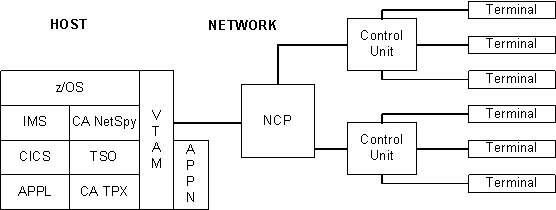
The Network Data Collection VTAM interface monitors specific VTAM sessions in the host. Regions interface with VTAM routines to collect traffic and response time statistics for all ongoing sessions for applications you specify, for example, TSO, IDMS, IMS, CICS, and VSCS.
The VTAM interface collects data that helps you set and evaluate service level objectives. The collected VTAM data includes the following information:
The VTAM interface monitors virtual routes, including LU 6.2 traffic, for statistics that help you determine where network delays occur. The interface also helps identify problems with application design.
The VTAM interface requires no modifications to your system or VTAM code. You can start and stop regions without affecting your network operations because all interfaces with VTAM are put in place dynamically when the region starts and restored when it stops.
CA NetSpy interfaces to VTAM's performance monitor interface (PMI) to collect Advanced Peer-to-Peer Networking (APPN) performance information. The following data is collected:
The NCP interface, which supports the Network Performance Analyzer (NPA) interface included in NCP, monitors all of the NCPs that you specify. The collected NCP data includes the following:
The NCP interface accesses network performance data through standard SNA interfaces to monitor the hardware-related aspects of your network's performance.
The NCP interface uses established VTAM and NCP user facilities and is independent of operating system and VTAM releases.
CA NetSpy can collect and record network session accounting statistics using the NCP's SESSACC feature (ACF/NCP). Statistics are recorded for boundary nodes in session with the NCP and VTAM host with which CA NetSpy is running. Session statistics include session start and stop configuration information as well as PIU and byte statistics for the session. Interval records are written based on user-supplied PIU and byte thresholds in the NCP generation or CA NetSpy parameters.
CA NetSpy can collect and record network gateway accounting statistics if in session with a gateway NCP that uses the NCP gateway accounting feature. Session start, stop, and interval records are written for SNI sessions in the same manner as network session statistics are for boundary nodes.
The ACF/NCP option of providing dynamic reconfiguration information across the NCP's NPALU is supported. CA NetSpy receives an update of any dynamic reconfiguration of the network from the NCP and then updates the network and session statistics accordingly.
The following are more detailed descriptions of some of the NCP data collected:
The Interactive Component lets you access all CA NetSpy information and lets authorized operators control CA NetSpy execution. The following are functions of the Interactive Component:
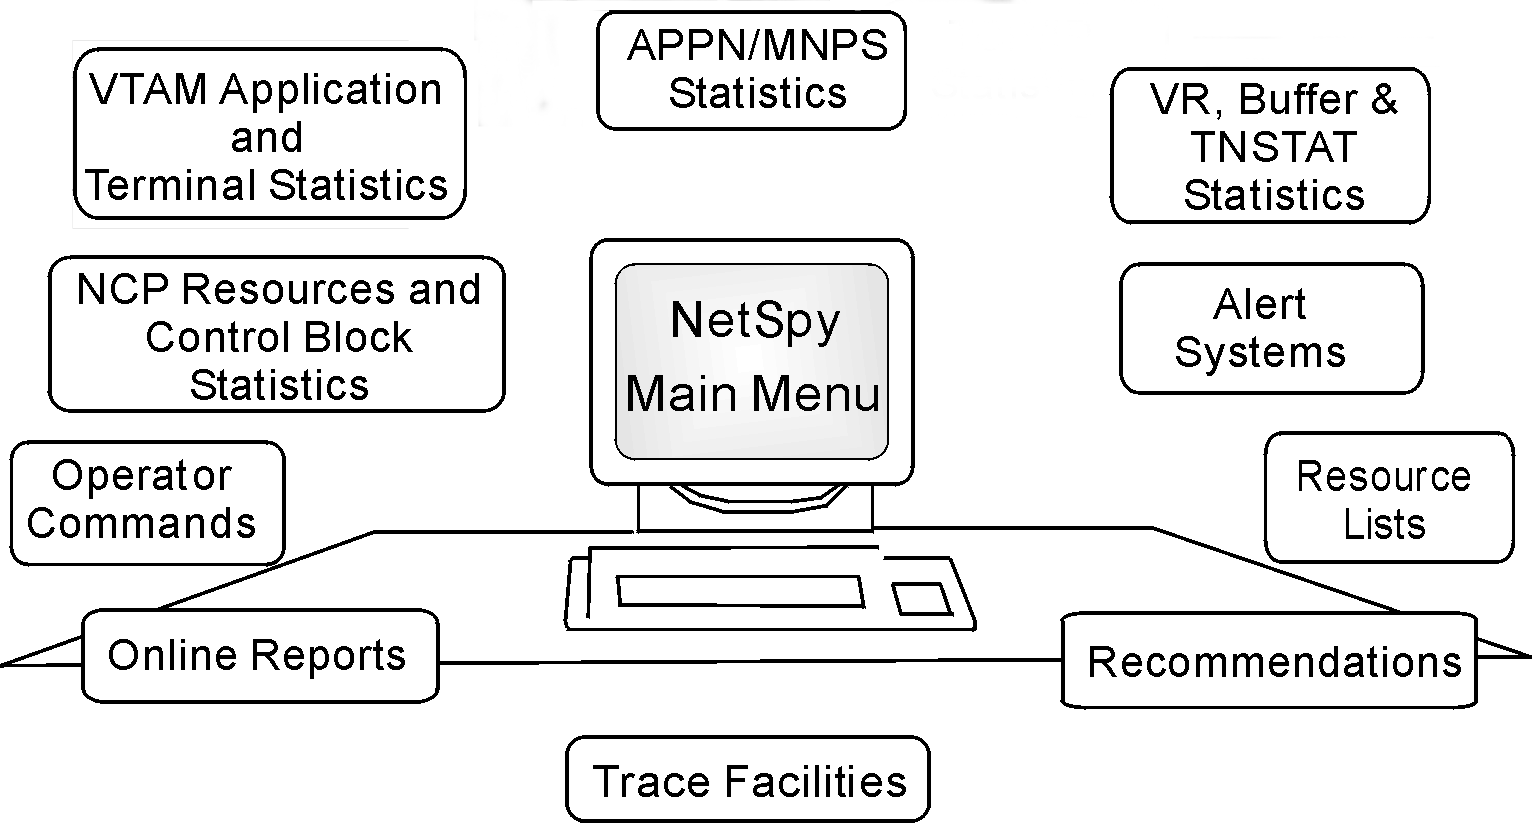
Using various screens, commands, and parameters, you can view specific information about network performance. The Interactive Component produces the displays and reports from the network statistics that Network Data Collection gathers.
The following diagram shows the facilities you can access from the main menu.
The following batch reports are provided to describe network activities:
Prints the statistics for any network resource that exceeds your predefined threshold.
Provides a performance overview of a specified network resource in list format.
Provides a performance overview of a specified network resource in graphic format.
Batch reports can be created from the data stored in SMF or the log.
Most aspects of network performance and equipment usage is reported on with these batch formats. You can also create customized reports with the parameter-driven reporting system.
The Modeling and Recommendations component comprises the following functions:
Lets you create "what if" scenarios to determine the impact of changes to SNA boundary lines on total response time.
Provides suggestions on how to improve your network response time in the boundary line areas of your network.
After you propose specific network changes, changes in response times can be projected. For example, you may want to know how adding ten terminals to your current hardware configuration will affect network response time. In this case, the impact of these additional terminals on network response time can be calculated before you make the final decision to add them.
Modeling and Recommendations can also propose changes in the following areas:
You can model characteristics in each of these areas on separate screens. Each modeling screen shows the actual and the proposed configurations for variables associated with the characteristic you want to model. It lets you enter proposed changes to your hardware configuration and see how the changes affect the network.
After you have modeled your proposed network changes, the recommendations function advises you how to optimize network response time. The recommendations function uses actual network data that has been written in log files to make suggestions for hardware and traffic characteristics, as well as NCP parameters. Each recommendation advises you what to change and explains the effect this change will have on your network.