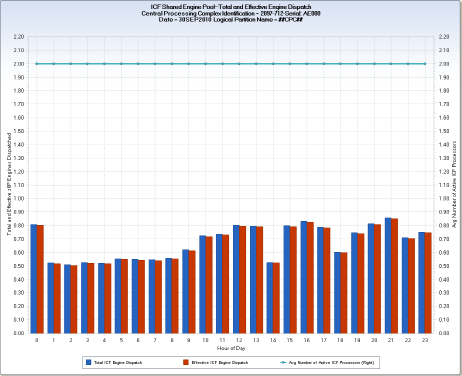
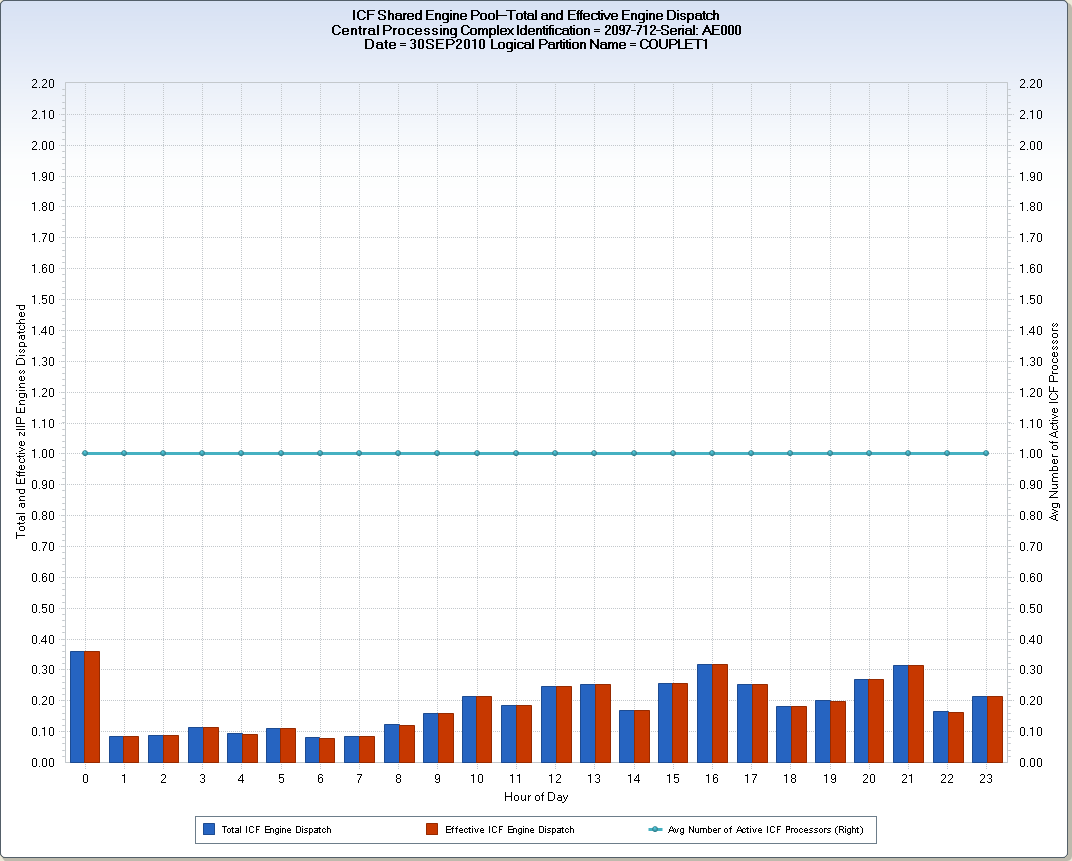
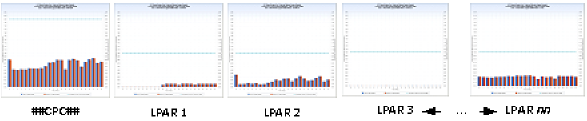
The RMFICD query creates a single data extract CSV showing hourly CPC and LPAR dispatch percentages for the shared ICF (Integrated Coupling Facility) engine pool. For each Central Processing Complex (CPC) in the DAYS timespan HARLPC file, the query generates a CPC level chart. The chart uses vertical bars to show the total and effective dispatch percentage of the physical ICF engines for each hour of the day—plus a horizontal reference line showing the total number of physical engines in the shared ICF processor pool. The CPC level chart is followed by individual charts for each LPAR in the CPC, showing the dispatch percentages of the logical ICF engines assigned to the LPAR. For the LPAR charts, the horizontal reference line shows the number of logical ICF engines active for the LPAR.
The difference between total and effective dispatch represents the amount of the engine resource pool required for multiprocessing management overhead.
This query is used to monitor the overall shared ICF pool engine utilization of each CPC at an hour granularity. The individual LPAR views show to what extent each LPAR is using the logical ICF engines available for its use. Even though the CPC level and LPAR level charts use the same chart variables, the actual values charted are different.
CPC and LPAR Daily ICF Engine Dispatch
This query generates a single data extract, but data manipulation is used to convert the "PHYSICAL" LPAR to a CPC level view of shared ICF pool engine dispatch, where the LPAR name is changed to "##CPC##’. The following data extract description is presented in two parts: one describing the element values plotted for the CPC level chart, and the other describing the element values plotted for the individual LPARs.
For the CPC level chart, CPC level PR/SM data element values are substituted for the LPAR data elements:
ENGDISPT – Total ICF Engine Dispatch (Set to PRSMTIST – Total ICF Dispatch Time – Shared / 3600)
ENGDISPE – Effective ICF Engine Dispatch (Set to PRSMTIET – Total ICF Dispatch Time - Effective / 3600)
This vertical bars, for the CPC level LPAR ##CPC##, show the total and effective dispatch of the physical processors in the entire shared ICF engine pool. For this chart, a user data step takes the following actions before the ENGDISPT and ENGDISPE derivations:
This process permits a CPC level view of the physical shared ICF engine pool dispatch activity. The total and effective dispatch times are divided by 3600 to convert from seconds of dispatch to hours of dispatch. Because one engine can be dispatched a maximum of one hour, per hour, this conversion allows the dispatch of the engine pool to be represented as physical engine dispatch hour equivalents. For example, three ICF engines could, at full utilization, provide three hours of dispatch time in one hour.
LPCAVICF - Avg Number of Active ICF Processors (Set to PRSMAISP – Avg ICF Sharable Processors)
This horizontal reference line, for the CPC level LPAR ##CPC##, shows the average number of physical processors in the shared ICF engine pool. While the data extract plots data element LPCAVICF, which is the average number of logical ICF engines assigned to an LPAR—for the ##CPC## chart, a user data step populates LPCAVICF with the value for PRSMAISP—which is the average number of physical engines in the shared ICF engine pool. The actual dispatch engine equivalents, charted with the vertical bars, can reach, but should never exceed this line. IBM features like capacity provisioning and on/off capacity on demand can activate and deactivate physical processors—so this line may not reflect a constant value over the entire day.
HOUR – Hour of Day
The LPAR level charts use standard HARLPC file data elements to derive the dispatch variables:
ENGDISPT – Total ICF Engine Dispatch (Set to LPCSIDTM – Total shared ICF Proc. Dispatch Time / 3600)
ENGDISPE – Effective ICF Engine Dispatch (Set to LPCSIEDT – Total Shr ICF Proc. Effec.Dispatch Time / 3600)
The vertical bars, for the LPAR level charts, show the total and effective dispatch of the logical ICF processors assigned to the LPAR. The total and effective dispatch times are divided by 3600 to convert from seconds of dispatch to hours of dispatch. Because one engine can be dispatched a maximum of one hour, per hour, this conversion allows the dispatch of the engine pool to be represented as logical engine dispatch hour equivalents. For example, three logical ICF engines could, at full utilization, provide three hours of dispatch time in one hour.
LPCAVICF - Avg Number of Active ICF Processors
This horizontal reference line, for the LPAR level charts, show the average number of logical ICF processors assigned to the LPAR. The actual dispatch engine equivalents, charted with the vertical bars, can reach, but should never exceed this line. IBM features like the Intelligent Resource Director (IRD) can activate and deactivate logical processors at the LPAR level—so this line may not reflect a constant value over the entire day.
HOUR – Hour of Day
DATEPART(ENDTS)
TRIM(LPCMOD)||'-'||TRIM(CPCMODID)||'-Serial: '||SUBSTR(CPCSEQNB,12,5);
ROUND((LPCSIEDT/3600),.1) ;
ROUND((LPCSIDTM/3600),.1) ;
The following modifications can be made to the RMFICD query:
| Copyright © 2011 CA. All rights reserved. | Email CA Technologies about this topic |