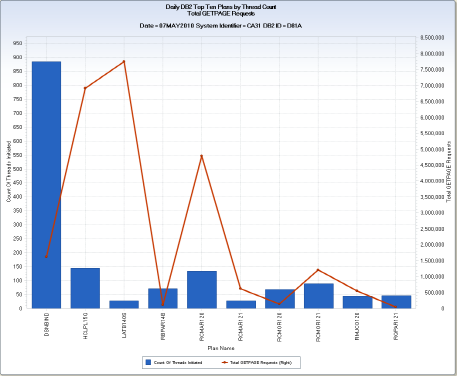
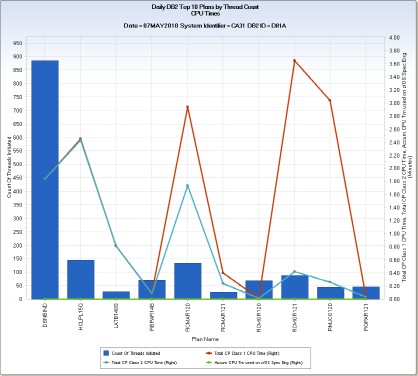
The DB2T10 query generates two daily charts for each DB2 Region. The charts shows resource usage for the top nn (default 10) DB2 Plans by count of threads initiated. Both charts show the number of threads initiated, using vertical bars. One of the charts shows the number of GETPAGE requests, and the other chart shows Class 1, Class 2, and Specialty engine CPU time use for the top ten plans.
The top example shows the daily GETPAGE and thread count for DB2 region D81A running on SYSID CA31. DB2 Plan "LATB140S" only had 27 threads initiated, but had almost eight million GETPAGE requests.
The second example shows the CPU time use for the same DB2 region. DB2 Plan "RCMOR121" used the most Class 1 CPU Time—3.65 minutes.
This query is useful to observe the resource utilization patterns for your top DB2 plans.
DB2 Daily Top 10 Plans Threads and GPage
DSPNTHRD – Count of Threads Initiated
DSPSGPGR – Total GETPAGE Requests
DB2PLAN – Plan Name
DB2 Daily Top 10 Plans Threads and CPU
DSPNTHRD – Count of Threads Initiated
DSPCP1TM – Total CP Class 1 CPU Time
DSPCP2TM – Total CP Class 2 CPU Time
DSPCPUZ1 – Accum CPU Tm used on z/OS Spec Eng
DB2PLAN – Plan Name
DATEPART(ENDTS)
MAX(DSNPTHRD, SUM(DSPCOMM2,DSPABORT));
The following modifications can be made to the query:
DATEPART(ENDTS) ;
MAX(DSNPTHRD,SUM(DSPCOMM2,DSPABORT));
DSPTCBTM / COUNT ;
DSPTELPT / COUNT ;
DSPSGPGR / COUNT ;
DSPSRIO / COUNT ;
DSPSPRFH / COUNT ;
DSPMXPL / COUNT ;
DSPSSPRU / COUNT ;
The following modifications can be made to the DB2T10 query:
| Copyright © 2011 CA. All rights reserved. | Email CA Technologies about this topic |