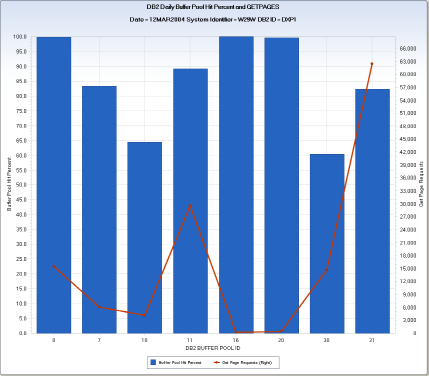
The DB2BPH query produces a daily chart. The chart shows the total Get Page Requests for each buffer pool and the percentage of requests that were satisfied from the buffer pool (hits). The hit percentage is displayed using vertical bars and the total Get Page Requests are shown using a horizontal line.
The example shows the daily chart generated for DB2 Region DXP1 running on SYSID W29W. Buffer pool 31 had the greatest number of Get Page Requests (62,489) with a buffer pool hit percentage of 82.3 percent.
This query is useful to identify buffer pools that are not large enough to hold frequently requested data. When requested data is not in the buffer pool, the data must be acquired by reading from DASD, degrading transaction response time. Analyze buffer pools with low hit percentages to determine if changes can be made to improve transaction performance.
DB2 Daily Buffer Pool Hit Percent
BPHIT – Buffer Pool Hit Percent
DBUGPGR – Get Page Requests
DB2PID – Buffer Pool ID
DATEPART(ENDTS)
TEMPDPF=DBUDPF ;
TEMP=DBUGPGR-SUM(DBUPRFH, DBULPF, TEMPDPF, DBUSRIO);
IF DBUGPGR GT 0 AND TEMP GT 0 THEN DO ;
    BPHIT = (TEMP / DBUGPGR) * 100;
END ;
The following modifications can be made to the DB2BPH query:
Note: This query charts a nonessential data element: DBUDPF (No. Times Dynamic Prefetch Req). If this data element is not active in your DBPDBU file, the query will not fail, but the computed value for buffer hit ratio may be understated. You can ask your CA MICS administrator to check and see if this data element is active. If not, it can be activated by changing the element definition in sharedprefix.MICS.GENLIB(DB2GENIN) from NAMX to NAME and then running the sharedprefix.MICS.CNTL(DB2CGEN) job. After this element is activated, refresh the Q&R Meta Database.
| Copyright © 2011 CA. All rights reserved. | Email CA Technologies about this topic |