Administration Guide › Monitor the Directory › Monitoring with DXmanager › Maps Tab › Example: Topology Map Showing Health and Load
Example: Topology Map Showing Health and Load
The following topology map shows the sample directory described in How to Set Up the Sample Directories:
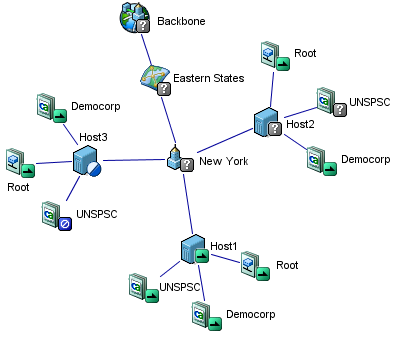
The icons show the status of each DSA, and the blue lines show the load on each DSA. Thicker lines show greater load.
The status of the entire backbone is derived using the following steps:
- On Host1, all DSAs are running. The host icon also shows the green icon, because all of its DSAs are running.
- On Host2, two DSAs are running, but the status of the third is unknown. The host shows the worst status, which is unknown.
- On Host3, two DSAs are running and one is stopped. The host icon shows the blue-and-white status icon, to show that some of its DSAs are running and some are stopped.
- The site icon shows the worst status of the hosts in that site, which is unknown.
- The region has only one site, and the backbone has only one region, so those icons also show the gray icon.
In this way, the Topology map reveals that this directory backbone is in poor health. The DSA with the status of unknown must be fixed.

